

Question: Use Excel to create the plot and use Data/Data Analysis/Regression to run the regression analysis . A suburban hotel derives its revenue from both hotel
Use Excel to create the plot and use Data/Data Analysis/Regression to run the regression analysis
. A suburban hotel derives its revenue from both hotel and restaurant operations. The owners are interested in the relationship between the number of rooms occupied on a nightly basis and the revenue per day in the restaurant. A sample of 25 days has been taken and the data provided in the Excel file. Rooms vs Revenue reg
Copy the data into your Excel file.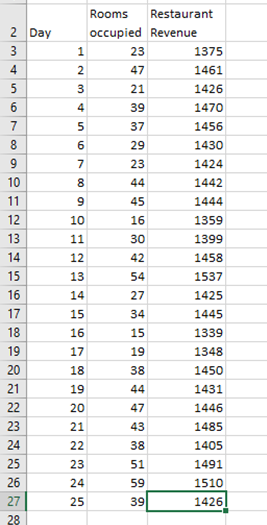
Use the Excel output to answer the questions below
e What is the p-value for the test of the slope?
What conclusion do you make based on this p-value?
f. What is the regression formula that expresses the relationship between Rooms occupied and Restaurant Revenue?
g. Use your regression formula to forecast Restaurant Revenue if 45 Rooms are occupied.
h. Use your regression formula to forecast Restaurant Revenue if 25 Rooms are occupied.
Rooms Restaurant 2 Day occupied Revenue Nm 1 23 1375 4 2 47 1461 5 3 21 1426 6 4 39 1470 7 5 37 1456 8 6 5 29 1430 9 7 23 1424 10 8 44 1442 11 9 45 1444 12 10 1359 13 11 1399 14 12 1458 15 13 1537 16 14 1425 F G D 1 2 3 4 5 6 8 17 1445 18 1339 19 1348 20 1450 21 44 1431 22 1 2 3 4 5 8 8 47 1446 23 43 1485 24 38 1405 25 51 1491 26 24 59 1510 27 39 14261 28Step by Step Solution
There are 3 Steps involved in it

Get step-by-step solutions from verified subject matter experts