Question: Use Excel to work through the following exercises. I'm having difficulty with the whole assignment. I posted all of the assignment in multiple pictures. Background
Use Excel to work through the following exercises. I'm having difficulty with the whole assignment. I posted all of the assignment in multiple pictures.
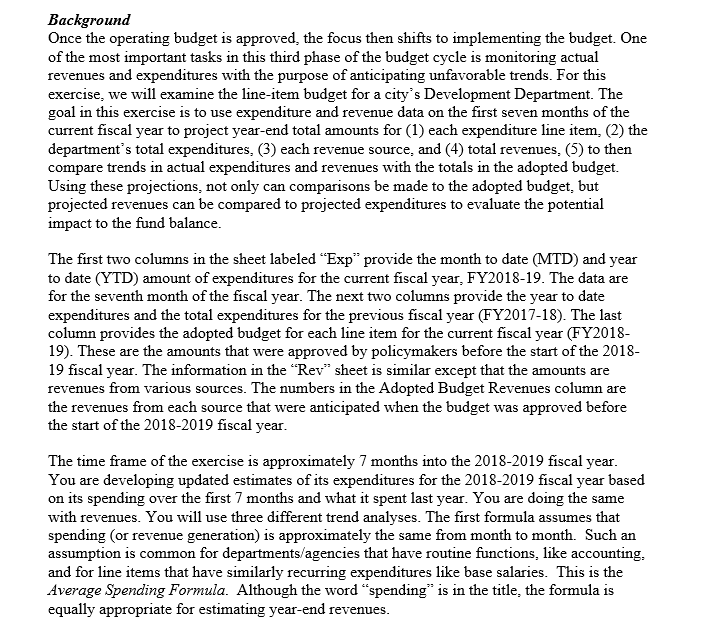
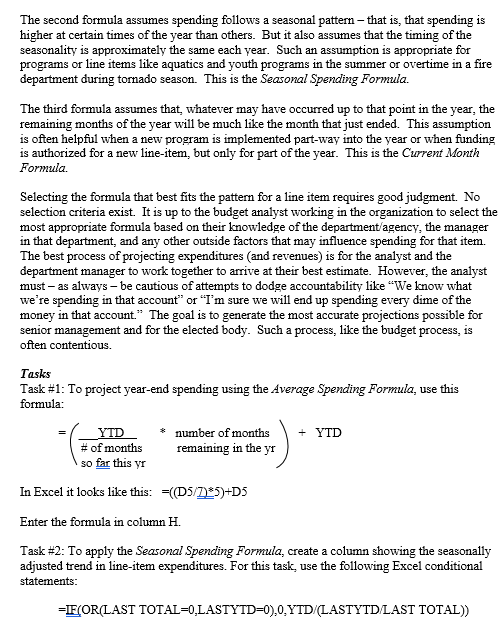
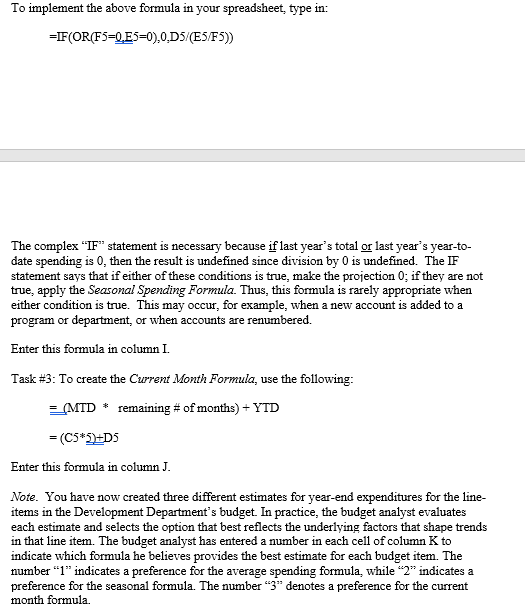
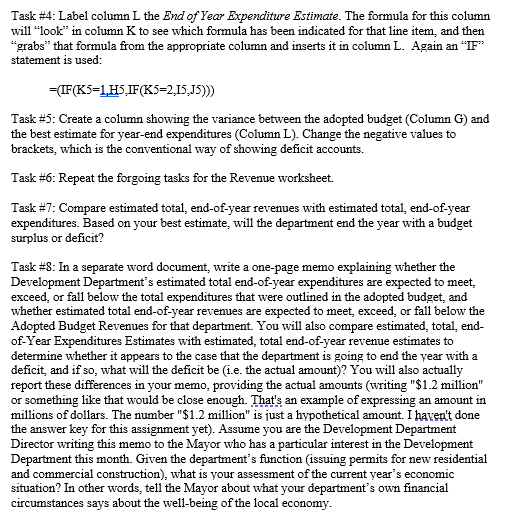
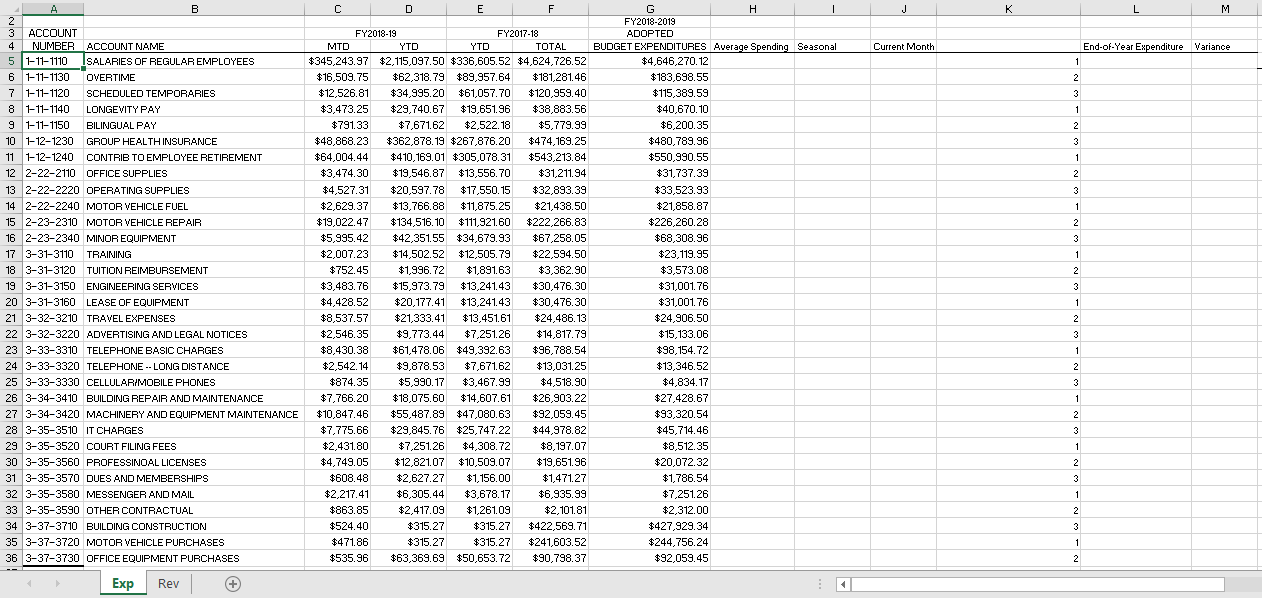
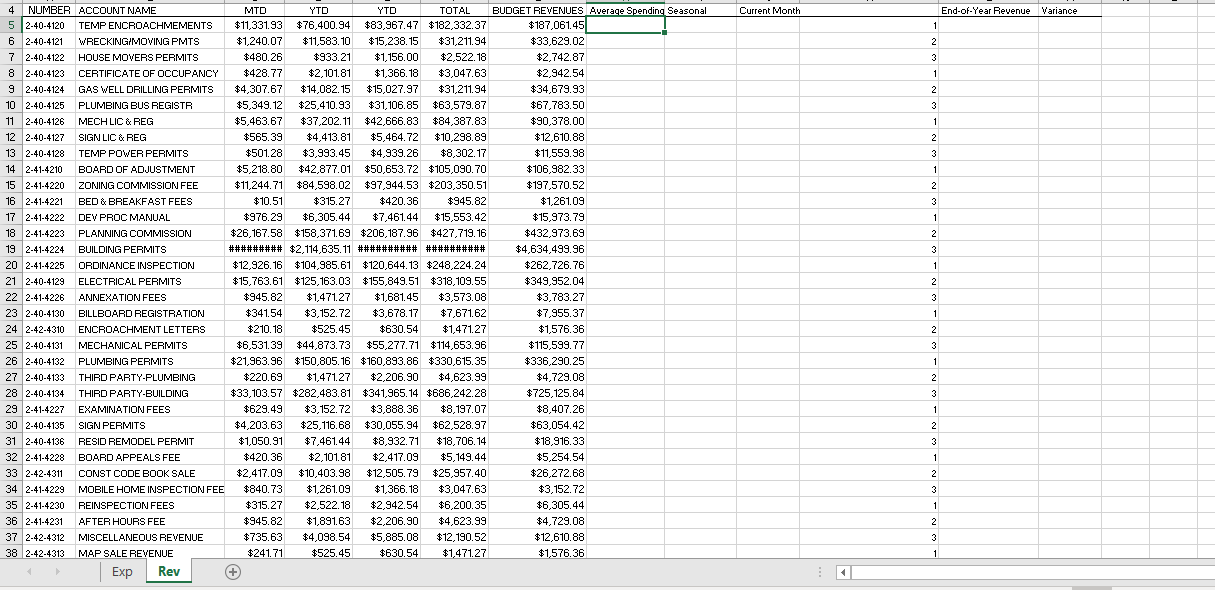
Background Once the operating budget is approved, the focus then shifts to implementing the budget. One of the most important tasks in this third phase of the budget cycle is monitoring actual revenues and expenditures with the purpose of anticipating unfavorable trends. For this exercise, we will examine the line-item budget for a city's Development Department. The goal in this exercise is to use expenditure and revenue data on the first seven months of the current fiscal year to project year-end total amounts for (1) each expenditure line item, (2) the department's total expenditures, (3) each revenue source, and (4) total revenues, (5) to then compare trends in actual expenditures and revenues with the totals in the adopted budget. Using these projections, not only can comparisons be made to the adopted budget, but projected revenues can be compared to projected expenditures to evaluate the potential impact to the fund balance. The first two columns in the sheet labeled Exp provide the month to date (MTD) and year to date (YTD) amount of expenditures for the current fiscal year, FY2018-19. The data are for the seventh month of the fiscal year. The next two columns provide the year to date expenditures and the total expenditures for the previous fiscal year (FY2017-18). The last column provides the adopted budget for each line item for the current fiscal year (FY2018- 19). These are the amounts that were approved by policymakers before the start of the 2018- 19 fiscal year. The information in the "Rev" sheet is similar except that the amounts are revenues from various sources. The numbers in the Adopted Budget Revenues column are the revenues from each source that were anticipated when the budget was approved before the start of the 2018-2019 fiscal year. The time frame of the exercise is approximately 7 months into the 2018-2019 fiscal year. You are developing updated estimates of its expenditures for the 2018-2019 fiscal year based on its spending over the first 7 months and what it spent last year. You are doing the same with revenues. You will use three different trend analyses. The first formula assumes that spending (or revenue generation) is approximately the same from month to month. Such an assumption is common for departments/agencies that have routine functions, like accounting, and for line items that have similarly recurring expenditures like base salaries. This is the Average Spending Formula. Although the word spending" is in the title, the formula is equally appropriate for estimating year-end revenues. The second formula assumes spending follows a seasonal pattern - that is, that spending is higher at certain times of the year than others. But it also assumes that the timing of the seasonality is approximately the same each year. Such an assumption is appropriate for programs or line items like aquatics and youth programs in the summer or overtime in a fire department during tornado season. This is the Seasonal Spending Formula. The third formula assumes that, whatever may have occurred up to that point in the year, the remaining months of the year will be much like the month that just ended. This assumption is often helpful when a new program is implemented part-way into the year or when funding is authorized for a new line-item, but only for part of the year. This is the Current Month Formula Selecting the formula that best fits the pattern for a line item requires good judgment. No selection criteria exist. It is up to the budget analyst working in the organization to select the most appropriate formula based on their knowledge of the department agency, the manager in that department, and any other outside factors that may influence spending for that item. The best process of projecting expenditures and revenues) is for the analyst and the department manager to work together to arrive at their best estimate. However, the analyst must - as always be cautious of attempts to dodge accountability like "We know what we're spending in that account" or "I'm sure we will end up spending every dime of the money in that account." The goal is to generate the most accurate projections possible for senior management and for the elected body. Such a process, like the budget process, is often contentious. Tasks Task #1: To project year-end spending using the Average Spending Formula, use this formula: YTD number of months + YTD #of months remaining in the yr so far this yr In Excel it looks like this: =((D5/7185)+D5 Enter the formula in column H. Task #2: To apply the Seasonal Spending Formula, create a column showing the seasonally adjusted trend in line-item expenditures. For this task, use the following Excel conditional statements: =IF(OR(LAST TOTAL=0.LASTYTD=0).0.YTD/(LASTYTD/LAST TOTAL)) To implement the above formula in your spreadsheet, type in: =IF (OR(F5=Q.E5=0).0.D5/(E5/F5)) The complex IF statement is necessary because if last year's total or last year's year-to- date spending is 0, then the result is undefined since division by 0 is undefined. The IF statement says that if either of these conditions is true, make the projection 0; if they are not true, apply the Seasonal Spending Formula. Thus, this formula is rarely appropriate when either condition is true. This may occur, for example, when a new account is added to a program or department, or when accounts are renumbered. Enter this formula in column I. Task #3: To create the Current Month Formula, use the following: (MTD remaining # of months) + YTD = (C5*2=D5 Enter this formula in column J. Note. You have now created three different estimates for year-end expenditures for the line- items in the Development Department's budget. In practice, the budget analyst evaluates each estimate and selects the option that best reflects the underlying factors that shape trends in that line item. The budget analyst has entered a number in each cell of column K to indicate which formula he believes provides the best estimate for each budget item. The number l indicates a preference for the average spending formula, while "2" indicates a preference for the seasonal formula. The number "3" denotes a preference for the current month formula Task #4: Label column L the End of Year Expenditure Estimate. The formula for this column will "look" in column K to see which formula has been indicated for that line item, and then "grabs" that formula from the appropriate column and inserts it in column L. Again an IF statement is used: =(IF(K5=1,H5,IF(K5=2,15,15))) Task #5: Create a column showing the variance between the adopted budget (Column G) and the best estimate for year-end expenditures (Column L). Change the negative values to brackets, which is the conventional way of showing deficit accounts. Task #6: Repeat the forgoing tasks for the Revenue worksheet. Task #7: Compare estimated total, end-of-year revenues with estimated total, end-of-year expenditures. Based on your best estimate, will the department end the year with a budget surplus or deficit? Task #8: In a separate word document, write a one-page memo explaining whether the Development Department's estimated total end-of-year expenditures are expected to meet, exceed, or fall below the total expenditures that were outlined in the adopted budget, and whether estimated total end-of-year revenues are expected to meet exceed, or fall below the Adopted Budget Revenues for that department. You will also compare estimated, total, end- of-Year Expenditures Estimates with estimated, total end-of-year revenue estimates to determine whether it appears to the case that the department is going to end the year with a deficit, and if so, what will the deficit be (i.e. the actual amount)? You will also actually report these differences in your memo, providing the actual amounts (writing "$1.2 million" or something like that would be close enough. That's an example of expressing an amount in millions of dollars. The number "$1.2 million" is just a hypothetical amount. I haven't done the answer key for this assignment yet). Assume you are the Development Department Director writing this memo to the Mayor who has a particular interest in the Development Department this month. Given the department's function issuing permits for new residential and commercial construction), what is your assessment of the current year's economic situation? In other words, tell the Mayor about what your department's own financial circumstances says about the well-being of the local economy. C E F J K L M Current Month End-of-Year Expenditure Variance 1 2 3 1 2 3 1 2 3 1 2 - 3 A B 2 3 ACCOUNT 4 NUMBER ACCOUNT NAME 5 1-11-1110 SALARIES OF REGULAR EMPLOYEES 6 1-11-1130 OVERTIME 7 1-11-1120 SCHEDULED TEMPORARIES 8 1-11-1140 LONGEVITY PAY 9 1-11-1150 BILINGUAL PAY 10 1-12-1230 GROUP HEALTH INSURANCE 11 1-12-1240 CONTRIB TO EMPLOYEE RETIREMENT Name 12 2-22-2110 OFFICE SUPPLIES 13 2-22-2220 OPERATING SUPPLIES 120 2220 OFERT 14 2-22-2240 MOTOR VEHICLE FUEL WSCY MOTOn ve ICLE 15 2-23-2310 MOTOR VEHICLE REPAIR 16 2-23-2340 MINOR EQUIPMENT menewIMENT 17 3-31-3110 TRAINING . """ 18 3-31-3120 TUITION REIMBURSEMENT .. 19 3-31-3150 ENGINEERING SERVICES 20 3-31-3160 LEASE OF EQUIPMENT See ! 21 3-32-3210 TRAVEL EXPENSES "HAEL FARENSES 22 3-32-3220 ADVERTISING AND LEGAL NOTICES woman 23 3-33-3310 TELEPHONE BASIC CHARGES Sons 24 3-33-3320 TELEPHONE -- LONG DISTANCE 25 3-33-3330 CELLULARIMOBILE PHONES . 26 3-34-3410 BUILDING REPAIR AND MAINTENANCE - anner AI ANDMA 27 3-34-3420 MACHINERY AND EQUIPMENT MAINTENANCE 28 3-35-3510 IT CHARGES " 29 3-35-3520 COURT FILING FEES 30 3-35-3560 PROFESSINOAL LICENSES 31 3-35-3570 DUES AND MEMBERSHIPS 32 3-35-3580 MESSENGER AND MAIL 33 3-35-3590 OTHER CONTRACTUAL 34 3-37-3710 BUILDING CONSTRUCTION 35 3-37-3720 MOTOR VEHICLE PURCHASES 36 3-37-3730 OFFICE EQUIPMENT PURCHASES . I FY2018-2019 ADOPTED BUDGET EXPENDITURES Average Spending Seasonal $4,646,270.12 $183,698.55 $115,389.59 $40,670.10 le $6,200.35 $480,789.96 * $550,990.55 $31,737.39 $33,523.93 $21,858.87 * $226,260.28 $68,308,96 $23, 119.95 ce $3,573.08 www. $31,001.76 www.me $31,001.76 ...... $24,906.50 ... $15.133.06 ... $98,154.72 $13,346.52 $4.834 17 $27,428.67 $93,320.54 $45,714.46 we $8,512.35 G. $20,072.32 $1,786.54 $ $2,312.00 $427,929.34 $244,756.24 $92,059.45 FY2018-19 FY2017-18 MTD YTD YTD TOTAL $345,243.97 $2,115,097.50 $336,605.52 $4,624,726.52 $16,509.75 $62,318.79 $89,957.64 $181,28146 $12,526.81 $34,995.20 $61,057.70 $120,959.40 $3,473.25 $29,740.67 $19,651.96 $38,883.56 $791.33 $7,67162 $2,522.18 $5,779.99 $48,868.23 $362,878.19 $267,876.20 $474,169.25 $64,004.44 $410,169.01 $305,078.31 $543,213.84 ---- ....... $3,474.30 $19,546.87 $13,556.70 $31,211.94 be he $4,527.31 $20,597.78 4,221. $17,550.15 $32,893.39 $2,629.37 $13,766.88 $11,875.25 * 19, 100.00*11013.2 $21,438.50 *21*0. $19,022.47 $134,516.10 $111,921.60 $222,266.83 .. ins e $5,995.42 $42,351.55 $34,679.93 $67,258.05 ** ... $2,007.23 $14,502.52 $12,505.79 $22.594.50 wie . $752.45 $1,996.72 $1,891.63 $3,362.90 . 1. .... $3.483.76 $15,973.79 $13,241.43 $30.476.30 * $4,428.52 $20,177.41 $13,241.43 $30.476.30 2011 . * $8,537.57 $21,333,41 $13,451.61 $24.486.13 Wom 12 m. $2,546.35 $9.773,44 ce $7.251.26 $14,817.79 WI w he $8,430.38 $61,478.06 $49,392.63 $96,788.54 red. $2.542.14 $9,878.53 $7,671.62 $13,031.25 $874.35 $5,990.17 $3,467.99 $4,518,90 ...... $7,766.20 $18,075.60 $14,607.61 $26.903.22 $10,847.46 $55,487.89 $47,080.63 $92.059.45 WWW $7.775.66 $29,845.76 $25,747.22 . To $44,978,82 * $2,431.80 $7,251.26 $4,308.72 $8,197.07 01.0 $4,749.05 $12,821.07 $10,509.07 $19,651.96 $608.48 $2,627.27 166.00 $1,156.00 $1,471.27 7.4 $2,217.41 $6,305.44 $3,678.17 $6,935.99 46 926 99 $863.85 teena $2,417.09 $2,101.81 $524.40 $315.27 +31627 $315.27 $422.569.71 $471.86 $ $315.27 $241,603.52 $535.96 $63,369.69 $50,653.72 $90,798.37 1 2 - 3 1 2 - 3 1 2 - 3 1 2 - 3 1 1 2 3 $7.251.26 1 $1,261.09 2 3 $315.27 1 2 Exp Rev Current Month End-of-Year Revenue Variance 1 2 2 3 1 2 2 3 1 1 2 3 1 1 21527 GEOS 2 3 1 1 $427,719.16 2 3 1 1 4 NUMBER ACCOUNT NAME MTD YTD YTD TOTAL BUDGET REVENUES Average Spending Seasonal 5 2-40-4120 TEMP ENCROACHMEMENTS $11,331.93 $76,400.94 $83,967.47 $182,332.37 $187,061.45 62-40-4121 WRECKINGIMOVING PMTS $1,240.07 $11,583.10 $ $15,238.15 $31,211.94 $33,629.02 7 2-40-4122 HOUSE MOVERS PERMITS $480.26 $933.21 $1,156.00 $2,522.18 $2,742.87 8 2.40-4123 CERTIFICATE OF OCCUPANCY +428 77 $2,101.81 1 366 18 $ $1,366.18 $2,342.54 2942 54 92404174 AG WEL 9 2-40-4124 GAS WELL DRILLING PERMITS $4,307.67 44 307 67 $ +15.027 97 $15,027.97 $31,211.94 $ $34,679.93 1010 10 2-40-4125 PLUMBING BUS REGISTR BE7997 $5,349.12 $25,410.93 108 85 $31, 106.85 $63,579.87 $ $67,783.50 1 240.000 LAB MECHLIC & REG 11 2-40-4126 $5,463.67 +27 202 11 442 666 83 $ $84,387.83 $90,378.00 IN DER EEE 20 12 2-40-4127 SIGN LIC & REG $565.39 $4,413.81 $5,464.72 $10,298.89 412 610 88 $12,670.88 132404400 13 2-40-4128 *50128 TEMP POWER PERMITS $501.28 $3,993.45 $4,939.26 $8,302.17 1 EGG $11,559.98 $ 14. DO $5 240 on 14 2-41-4210 BOARD OF ADJUSTMENT $5,218.80 $ $106 982 27 $106,982.33 15 2414220 ZONING COMMISSION FEE $11,244.71 $ $84,598.02 $97,944.53 $203,350.51 $197,570.52 10 16 2-41-4221 41054 BED & BREAKFAST FEES $10.51 $315.27 264.00 $420.36 $945.82 $1,261.09 17 18 BUDDOMANIA 17 2-41-4222 taze 20 t6 305 $976.29 DEV PROC MANUAL $6,305.44 $7,461.44 $15552 42 $15.972 70 $15,553.42 $15,973.79 40 18 2-41-4223 PLANNING COMMISSION $26 167 EO $ 40 BUILDINE PERMITE 19 2-41-4224 BUILDING PERMITS ######### $2,114,635.11 ########## ########## $ 20 20 2-41-4225 ORDINANCE INSPECTION $12.926.16 $104,985.61 $120 644.13 $248 224 24 $ 24 21 2-40-4129 ELECTRICAL PERMITS $15,763.61 $125,163.03 $155,849.51 $318,109.55 $ 22 2-41-4226 PUSTI ANNEXATION FEES 270227 $945.82 41 88145 $1,471.27 +2.672.09 $1,681.45 $3,573.08 $3,783.27 2240470 434154 $341.54 +916272 +267162 $3,152.72 23 2-40-4130 BILLBOARD REGISTRATION ZACE 27 $3,678.17 $ $7,671.62 $7.955.37 20240.000 24 2-42-4310 404040 COCAC ENCROACHMENT LETTERS $210.18 $525.45 +420 $630 CM $630.54 $1,471.27 $1,576.36 25 2-40-4131 MECHANICAL PERMITS $6.531 39 873.73 $55,277.71 $114,653.96 $115 59 77 ve 26 2-40-4132 PLUMBING PERMITS $21,963.96 $150,805.16 $160,893.86 $330,615.35 $ 2240470 27 2-40-4133 + 200 THIRD PARTY-PLUMBING $1,471.27 $220.69 $2,206.90 Ano $4,623.99 $4,729.08 20 40 722 THIRD PARTY-BUILDING $ 28 2-40-4134 THIRD PARTY 4725 126 $ $ $725, 125.84 29 2-41-4227 EXAMINATION FEES +629 g $629.49 +2 152 72 $3,152.72 +3889 36 $3,888.36 $8,197.07 $8,407.26 olm 30 2-40-4135 SIGN PERMITS $4,203.63 +4 $25,116.68 $30,055.94 $ $62,528.97 $63,054.42 31 2-40-4136 RESID REMODEL PERMIT $1,050.91 $7,461.44 $8,932.71 $18,706.14 $18.916.33 22.11.1978 32 2-41-4228 BOARD APPEALS FEE $420.36 $2,101.81 $2,417.09 $5,149.44 $5,254.54 33 2-42-4311 CONST CODE BOOK SALE $2,417.09 $10.403.98 $12,505.79 $25,957.40 $26,272.68 34 2-41-4229 MOBILE HOME INSPECTION FEE $840.73 $1,261.09 $1,366.18 $3,047.63 $3,152.72 35 2-41-4230 REINSPECTION FEES $315.27 $2,522.18 $2,942.54 $6,200.35 $6,305.44 36 2-41-4231 AFTER HOURS FEE $945.82 $1,891.63 $2,206.90 $4,623.99 $4,729.08 37 2-42-4312 MISCELLANEOUS REVENUE $735.63 $4,098.54 $5,885.08 $12, 190.52 $12,610.88 38 2-42-4313 MAP SALE REVENUE $241.71 $525.45 $630.54 $1.47127 $1,576.36 Exp Rev $ 2 47127 3 1 1 2 3 1 1 - $4 729.00 2 $ 3 1 1 2 2 3 1 2 3 1 2 3 1 Background Once the operating budget is approved, the focus then shifts to implementing the budget. One of the most important tasks in this third phase of the budget cycle is monitoring actual revenues and expenditures with the purpose of anticipating unfavorable trends. For this exercise, we will examine the line-item budget for a city's Development Department. The goal in this exercise is to use expenditure and revenue data on the first seven months of the current fiscal year to project year-end total amounts for (1) each expenditure line item, (2) the department's total expenditures, (3) each revenue source, and (4) total revenues, (5) to then compare trends in actual expenditures and revenues with the totals in the adopted budget. Using these projections, not only can comparisons be made to the adopted budget, but projected revenues can be compared to projected expenditures to evaluate the potential impact to the fund balance. The first two columns in the sheet labeled Exp provide the month to date (MTD) and year to date (YTD) amount of expenditures for the current fiscal year, FY2018-19. The data are for the seventh month of the fiscal year. The next two columns provide the year to date expenditures and the total expenditures for the previous fiscal year (FY2017-18). The last column provides the adopted budget for each line item for the current fiscal year (FY2018- 19). These are the amounts that were approved by policymakers before the start of the 2018- 19 fiscal year. The information in the "Rev" sheet is similar except that the amounts are revenues from various sources. The numbers in the Adopted Budget Revenues column are the revenues from each source that were anticipated when the budget was approved before the start of the 2018-2019 fiscal year. The time frame of the exercise is approximately 7 months into the 2018-2019 fiscal year. You are developing updated estimates of its expenditures for the 2018-2019 fiscal year based on its spending over the first 7 months and what it spent last year. You are doing the same with revenues. You will use three different trend analyses. The first formula assumes that spending (or revenue generation) is approximately the same from month to month. Such an assumption is common for departments/agencies that have routine functions, like accounting, and for line items that have similarly recurring expenditures like base salaries. This is the Average Spending Formula. Although the word spending" is in the title, the formula is equally appropriate for estimating year-end revenues. The second formula assumes spending follows a seasonal pattern - that is, that spending is higher at certain times of the year than others. But it also assumes that the timing of the seasonality is approximately the same each year. Such an assumption is appropriate for programs or line items like aquatics and youth programs in the summer or overtime in a fire department during tornado season. This is the Seasonal Spending Formula. The third formula assumes that, whatever may have occurred up to that point in the year, the remaining months of the year will be much like the month that just ended. This assumption is often helpful when a new program is implemented part-way into the year or when funding is authorized for a new line-item, but only for part of the year. This is the Current Month Formula Selecting the formula that best fits the pattern for a line item requires good judgment. No selection criteria exist. It is up to the budget analyst working in the organization to select the most appropriate formula based on their knowledge of the department agency, the manager in that department, and any other outside factors that may influence spending for that item. The best process of projecting expenditures and revenues) is for the analyst and the department manager to work together to arrive at their best estimate. However, the analyst must - as always be cautious of attempts to dodge accountability like "We know what we're spending in that account" or "I'm sure we will end up spending every dime of the money in that account." The goal is to generate the most accurate projections possible for senior management and for the elected body. Such a process, like the budget process, is often contentious. Tasks Task #1: To project year-end spending using the Average Spending Formula, use this formula: YTD number of months + YTD #of months remaining in the yr so far this yr In Excel it looks like this: =((D5/7185)+D5 Enter the formula in column H. Task #2: To apply the Seasonal Spending Formula, create a column showing the seasonally adjusted trend in line-item expenditures. For this task, use the following Excel conditional statements: =IF(OR(LAST TOTAL=0.LASTYTD=0).0.YTD/(LASTYTD/LAST TOTAL)) To implement the above formula in your spreadsheet, type in: =IF (OR(F5=Q.E5=0).0.D5/(E5/F5)) The complex IF statement is necessary because if last year's total or last year's year-to- date spending is 0, then the result is undefined since division by 0 is undefined. The IF statement says that if either of these conditions is true, make the projection 0; if they are not true, apply the Seasonal Spending Formula. Thus, this formula is rarely appropriate when either condition is true. This may occur, for example, when a new account is added to a program or department, or when accounts are renumbered. Enter this formula in column I. Task #3: To create the Current Month Formula, use the following: (MTD remaining # of months) + YTD = (C5*2=D5 Enter this formula in column J. Note. You have now created three different estimates for year-end expenditures for the line- items in the Development Department's budget. In practice, the budget analyst evaluates each estimate and selects the option that best reflects the underlying factors that shape trends in that line item. The budget analyst has entered a number in each cell of column K to indicate which formula he believes provides the best estimate for each budget item. The number l indicates a preference for the average spending formula, while "2" indicates a preference for the seasonal formula. The number "3" denotes a preference for the current month formula Task #4: Label column L the End of Year Expenditure Estimate. The formula for this column will "look" in column K to see which formula has been indicated for that line item, and then "grabs" that formula from the appropriate column and inserts it in column L. Again an IF statement is used: =(IF(K5=1,H5,IF(K5=2,15,15))) Task #5: Create a column showing the variance between the adopted budget (Column G) and the best estimate for year-end expenditures (Column L). Change the negative values to brackets, which is the conventional way of showing deficit accounts. Task #6: Repeat the forgoing tasks for the Revenue worksheet. Task #7: Compare estimated total, end-of-year revenues with estimated total, end-of-year expenditures. Based on your best estimate, will the department end the year with a budget surplus or deficit? Task #8: In a separate word document, write a one-page memo explaining whether the Development Department's estimated total end-of-year expenditures are expected to meet, exceed, or fall below the total expenditures that were outlined in the adopted budget, and whether estimated total end-of-year revenues are expected to meet exceed, or fall below the Adopted Budget Revenues for that department. You will also compare estimated, total, end- of-Year Expenditures Estimates with estimated, total end-of-year revenue estimates to determine whether it appears to the case that the department is going to end the year with a deficit, and if so, what will the deficit be (i.e. the actual amount)? You will also actually report these differences in your memo, providing the actual amounts (writing "$1.2 million" or something like that would be close enough. That's an example of expressing an amount in millions of dollars. The number "$1.2 million" is just a hypothetical amount. I haven't done the answer key for this assignment yet). Assume you are the Development Department Director writing this memo to the Mayor who has a particular interest in the Development Department this month. Given the department's function issuing permits for new residential and commercial construction), what is your assessment of the current year's economic situation? In other words, tell the Mayor about what your department's own financial circumstances says about the well-being of the local economy. C E F J K L M Current Month End-of-Year Expenditure Variance 1 2 3 1 2 3 1 2 3 1 2 - 3 A B 2 3 ACCOUNT 4 NUMBER ACCOUNT NAME 5 1-11-1110 SALARIES OF REGULAR EMPLOYEES 6 1-11-1130 OVERTIME 7 1-11-1120 SCHEDULED TEMPORARIES 8 1-11-1140 LONGEVITY PAY 9 1-11-1150 BILINGUAL PAY 10 1-12-1230 GROUP HEALTH INSURANCE 11 1-12-1240 CONTRIB TO EMPLOYEE RETIREMENT Name 12 2-22-2110 OFFICE SUPPLIES 13 2-22-2220 OPERATING SUPPLIES 120 2220 OFERT 14 2-22-2240 MOTOR VEHICLE FUEL WSCY MOTOn ve ICLE 15 2-23-2310 MOTOR VEHICLE REPAIR 16 2-23-2340 MINOR EQUIPMENT menewIMENT 17 3-31-3110 TRAINING . """ 18 3-31-3120 TUITION REIMBURSEMENT .. 19 3-31-3150 ENGINEERING SERVICES 20 3-31-3160 LEASE OF EQUIPMENT See ! 21 3-32-3210 TRAVEL EXPENSES "HAEL FARENSES 22 3-32-3220 ADVERTISING AND LEGAL NOTICES woman 23 3-33-3310 TELEPHONE BASIC CHARGES Sons 24 3-33-3320 TELEPHONE -- LONG DISTANCE 25 3-33-3330 CELLULARIMOBILE PHONES . 26 3-34-3410 BUILDING REPAIR AND MAINTENANCE - anner AI ANDMA 27 3-34-3420 MACHINERY AND EQUIPMENT MAINTENANCE 28 3-35-3510 IT CHARGES " 29 3-35-3520 COURT FILING FEES 30 3-35-3560 PROFESSINOAL LICENSES 31 3-35-3570 DUES AND MEMBERSHIPS 32 3-35-3580 MESSENGER AND MAIL 33 3-35-3590 OTHER CONTRACTUAL 34 3-37-3710 BUILDING CONSTRUCTION 35 3-37-3720 MOTOR VEHICLE PURCHASES 36 3-37-3730 OFFICE EQUIPMENT PURCHASES . I FY2018-2019 ADOPTED BUDGET EXPENDITURES Average Spending Seasonal $4,646,270.12 $183,698.55 $115,389.59 $40,670.10 le $6,200.35 $480,789.96 * $550,990.55 $31,737.39 $33,523.93 $21,858.87 * $226,260.28 $68,308,96 $23, 119.95 ce $3,573.08 www. $31,001.76 www.me $31,001.76 ...... $24,906.50 ... $15.133.06 ... $98,154.72 $13,346.52 $4.834 17 $27,428.67 $93,320.54 $45,714.46 we $8,512.35 G. $20,072.32 $1,786.54 $ $2,312.00 $427,929.34 $244,756.24 $92,059.45 FY2018-19 FY2017-18 MTD YTD YTD TOTAL $345,243.97 $2,115,097.50 $336,605.52 $4,624,726.52 $16,509.75 $62,318.79 $89,957.64 $181,28146 $12,526.81 $34,995.20 $61,057.70 $120,959.40 $3,473.25 $29,740.67 $19,651.96 $38,883.56 $791.33 $7,67162 $2,522.18 $5,779.99 $48,868.23 $362,878.19 $267,876.20 $474,169.25 $64,004.44 $410,169.01 $305,078.31 $543,213.84 ---- ....... $3,474.30 $19,546.87 $13,556.70 $31,211.94 be he $4,527.31 $20,597.78 4,221. $17,550.15 $32,893.39 $2,629.37 $13,766.88 $11,875.25 * 19, 100.00*11013.2 $21,438.50 *21*0. $19,022.47 $134,516.10 $111,921.60 $222,266.83 .. ins e $5,995.42 $42,351.55 $34,679.93 $67,258.05 ** ... $2,007.23 $14,502.52 $12,505.79 $22.594.50 wie . $752.45 $1,996.72 $1,891.63 $3,362.90 . 1. .... $3.483.76 $15,973.79 $13,241.43 $30.476.30 * $4,428.52 $20,177.41 $13,241.43 $30.476.30 2011 . * $8,537.57 $21,333,41 $13,451.61 $24.486.13 Wom 12 m. $2,546.35 $9.773,44 ce $7.251.26 $14,817.79 WI w he $8,430.38 $61,478.06 $49,392.63 $96,788.54 red. $2.542.14 $9,878.53 $7,671.62 $13,031.25 $874.35 $5,990.17 $3,467.99 $4,518,90 ...... $7,766.20 $18,075.60 $14,607.61 $26.903.22 $10,847.46 $55,487.89 $47,080.63 $92.059.45 WWW $7.775.66 $29,845.76 $25,747.22 . To $44,978,82 * $2,431.80 $7,251.26 $4,308.72 $8,197.07 01.0 $4,749.05 $12,821.07 $10,509.07 $19,651.96 $608.48 $2,627.27 166.00 $1,156.00 $1,471.27 7.4 $2,217.41 $6,305.44 $3,678.17 $6,935.99 46 926 99 $863.85 teena $2,417.09 $2,101.81 $524.40 $315.27 +31627 $315.27 $422.569.71 $471.86 $ $315.27 $241,603.52 $535.96 $63,369.69 $50,653.72 $90,798.37 1 2 - 3 1 2 - 3 1 2 - 3 1 2 - 3 1 1 2 3 $7.251.26 1 $1,261.09 2 3 $315.27 1 2 Exp Rev Current Month End-of-Year Revenue Variance 1 2 2 3 1 2 2 3 1 1 2 3 1 1 21527 GEOS 2 3 1 1 $427,719.16 2 3 1 1 4 NUMBER ACCOUNT NAME MTD YTD YTD TOTAL BUDGET REVENUES Average Spending Seasonal 5 2-40-4120 TEMP ENCROACHMEMENTS $11,331.93 $76,400.94 $83,967.47 $182,332.37 $187,061.45 62-40-4121 WRECKINGIMOVING PMTS $1,240.07 $11,583.10 $ $15,238.15 $31,211.94 $33,629.02 7 2-40-4122 HOUSE MOVERS PERMITS $480.26 $933.21 $1,156.00 $2,522.18 $2,742.87 8 2.40-4123 CERTIFICATE OF OCCUPANCY +428 77 $2,101.81 1 366 18 $ $1,366.18 $2,342.54 2942 54 92404174 AG WEL 9 2-40-4124 GAS WELL DRILLING PERMITS $4,307.67 44 307 67 $ +15.027 97 $15,027.97 $31,211.94 $ $34,679.93 1010 10 2-40-4125 PLUMBING BUS REGISTR BE7997 $5,349.12 $25,410.93 108 85 $31, 106.85 $63,579.87 $ $67,783.50 1 240.000 LAB MECHLIC & REG 11 2-40-4126 $5,463.67 +27 202 11 442 666 83 $ $84,387.83 $90,378.00 IN DER EEE 20 12 2-40-4127 SIGN LIC & REG $565.39 $4,413.81 $5,464.72 $10,298.89 412 610 88 $12,670.88 132404400 13 2-40-4128 *50128 TEMP POWER PERMITS $501.28 $3,993.45 $4,939.26 $8,302.17 1 EGG $11,559.98 $ 14. DO $5 240 on 14 2-41-4210 BOARD OF ADJUSTMENT $5,218.80 $ $106 982 27 $106,982.33 15 2414220 ZONING COMMISSION FEE $11,244.71 $ $84,598.02 $97,944.53 $203,350.51 $197,570.52 10 16 2-41-4221 41054 BED & BREAKFAST FEES $10.51 $315.27 264.00 $420.36 $945.82 $1,261.09 17 18 BUDDOMANIA 17 2-41-4222 taze 20 t6 305 $976.29 DEV PROC MANUAL $6,305.44 $7,461.44 $15552 42 $15.972 70 $15,553.42 $15,973.79 40 18 2-41-4223 PLANNING COMMISSION $26 167 EO $ 40 BUILDINE PERMITE 19 2-41-4224 BUILDING PERMITS ######### $2,114,635.11 ########## ########## $ 20 20 2-41-4225 ORDINANCE INSPECTION $12.926.16 $104,985.61 $120 644.13 $248 224 24 $ 24 21 2-40-4129 ELECTRICAL PERMITS $15,763.61 $125,163.03 $155,849.51 $318,109.55 $ 22 2-41-4226 PUSTI ANNEXATION FEES 270227 $945.82 41 88145 $1,471.27 +2.672.09 $1,681.45 $3,573.08 $3,783.27 2240470 434154 $341.54 +916272 +267162 $3,152.72 23 2-40-4130 BILLBOARD REGISTRATION ZACE 27 $3,678.17 $ $7,671.62 $7.955.37 20240.000 24 2-42-4310 404040 COCAC ENCROACHMENT LETTERS $210.18 $525.45 +420 $630 CM $630.54 $1,471.27 $1,576.36 25 2-40-4131 MECHANICAL PERMITS $6.531 39 873.73 $55,277.71 $114,653.96 $115 59 77 ve 26 2-40-4132 PLUMBING PERMITS $21,963.96 $150,805.16 $160,893.86 $330,615.35 $ 2240470 27 2-40-4133 + 200 THIRD PARTY-PLUMBING $1,471.27 $220.69 $2,206.90 Ano $4,623.99 $4,729.08 20 40 722 THIRD PARTY-BUILDING $ 28 2-40-4134 THIRD PARTY 4725 126 $ $ $725, 125.84 29 2-41-4227 EXAMINATION FEES +629 g $629.49 +2 152 72 $3,152.72 +3889 36 $3,888.36 $8,197.07 $8,407.26 olm 30 2-40-4135 SIGN PERMITS $4,203.63 +4 $25,116.68 $30,055.94 $ $62,528.97 $63,054.42 31 2-40-4136 RESID REMODEL PERMIT $1,050.91 $7,461.44 $8,932.71 $18,706.14 $18.916.33 22.11.1978 32 2-41-4228 BOARD APPEALS FEE $420.36 $2,101.81 $2,417.09 $5,149.44 $5,254.54 33 2-42-4311 CONST CODE BOOK SALE $2,417.09 $10.403.98 $12,505.79 $25,957.40 $26,272.68 34 2-41-4229 MOBILE HOME INSPECTION FEE $840.73 $1,261.09 $1,366.18 $3,047.63 $3,152.72 35 2-41-4230 REINSPECTION FEES $315.27 $2,522.18 $2,942.54 $6,200.35 $6,305.44 36 2-41-4231 AFTER HOURS FEE $945.82 $1,891.63 $2,206.90 $4,623.99 $4,729.08 37 2-42-4312 MISCELLANEOUS REVENUE $735.63 $4,098.54 $5,885.08 $12, 190.52 $12,610.88 38 2-42-4313 MAP SALE REVENUE $241.71 $525.45 $630.54 $1.47127 $1,576.36 Exp Rev $ 2 47127 3 1 1 2 3 1 1 - $4 729.00 2 $ 3 1 1 2 2 3 1 2 3 1 2 3 1


