

Question: . Use Excel worksheet to create a bar graph and a pie chart to represent the following: Grade Number of students 15 Label each segment
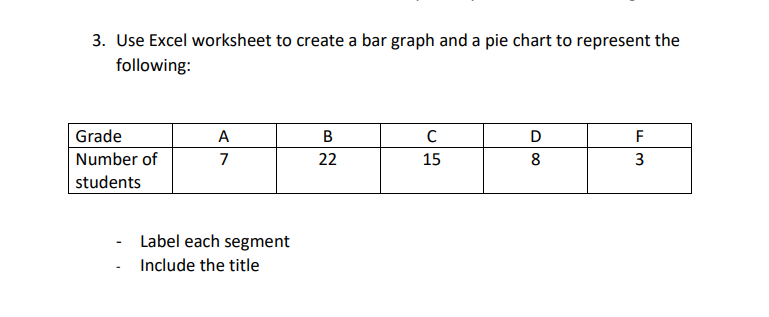
. Use Excel worksheet to create a bar graph and a pie chart to represent the following: Grade Number of students 15 Label each segment Include the title
Step by Step Solution
There are 3 Steps involved in it
1 Expert Approved Answer
Step: 1 Unlock

Question Has Been Solved by an Expert!
Get step-by-step solutions from verified subject matter experts
Step: 2 Unlock
Step: 3 Unlock