

Question: Use Figure: The Optimal Consumption Bundle and Take-Out Meals and Museum Visits. Which of the following could lead to an optimal consumption bundle on

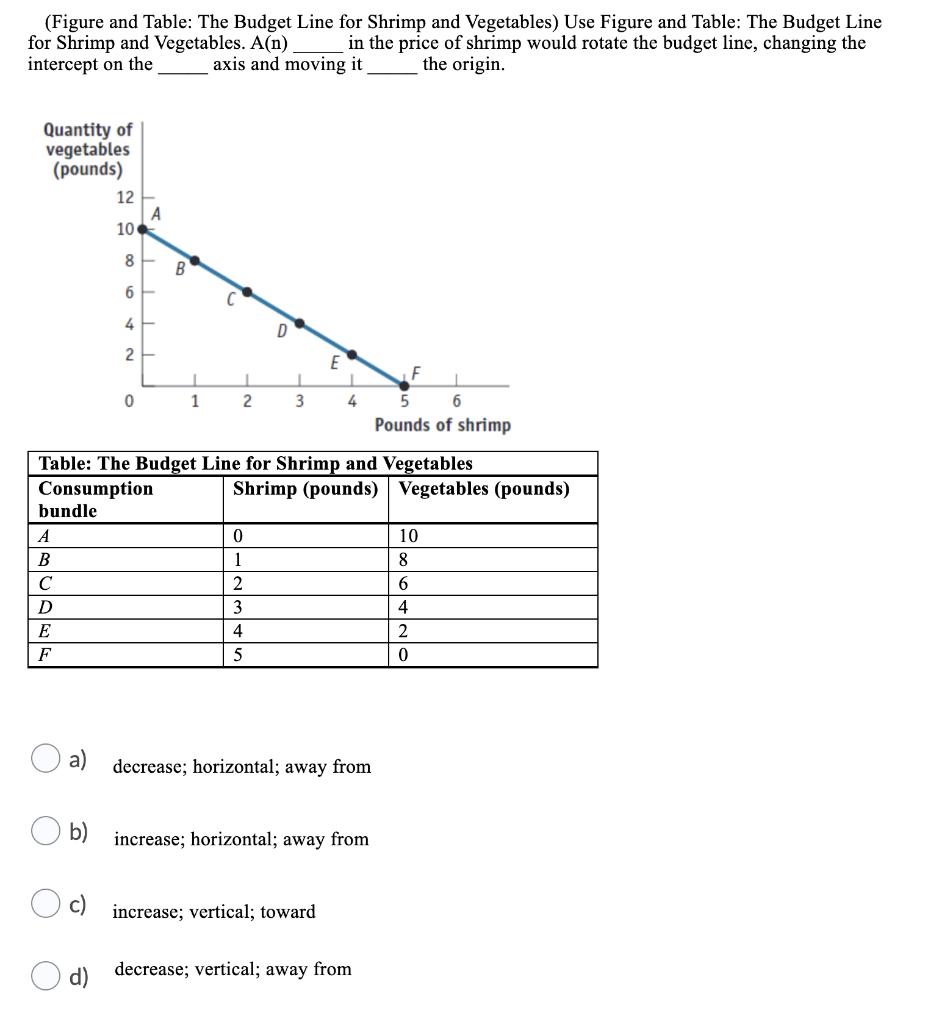
Use Figure: The Optimal Consumption Bundle and Take-Out Meals and Museum Visits. Which of the following could lead to an optimal consumption bundle on indifference curve 13? Quantity of take-out meals b) 80 70 60 50 40 30 20 10 0 2 B 4 6 a decrease in income 8 10 12 14 16 Quantity of museum visits an increase in the price of take-out meals an increase in the price of museum visits a decrease in the price of take-out meals (Figure and Table: The Budget Line for Shrimp and Vegetables) Use Figure and Table: The Budget Line for Shrimp and Vegetables. A(n) in the price of shrimp would rotate the budget line, changing the the origin. intercept on the axis and moving it Quantity of vegetables (pounds) C D E F a) b) 12 10 8 6 4 2 d) 0 A B 1 1 1 2 Pounds of shrimp Table: The Budget Line for Shrimp and Vegetables Consumption bundle A B D 0 1 1 3 2 3 4 5 E 4 Shrimp (pounds) Vegetables (pounds) c) increase; vertical; toward decrease; horizontal; away from increase; horizontal; away from F decrease; vertical; away from 10 8 6 4 2 0
Step by Step Solution
3.56 Rating (160 Votes )
There are 3 Steps involved in it

Get step-by-step solutions from verified subject matter experts