

Question: use graph and explain all A feed containing 50 mol% A and 50 mol% B is fed to a distillation column. A reflux ratio of
use graph and explain all
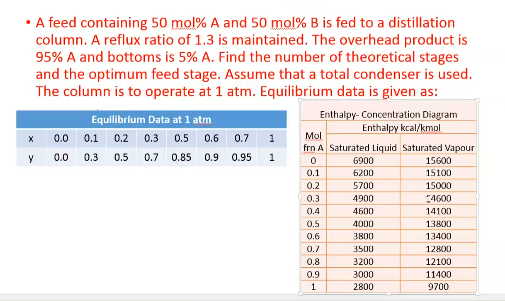
A feed containing 50 mol% A and 50 mol% B is fed to a distillation column. A reflux ratio of 1.3 is maintained. The overhead product is 95% A and bottoms is 5% A. Find the number of theoretical stages and the optimum feed stage. Assume that a total condenser is used. The column is to operate at 1 atm. Equilibrium data is given as: Equilibrium Data at 1 atm Enthalpy-Concentration Diagram 0.0 0.1 0.2 0.3 Enthalpy kcal/kmol 0.5 0.6 0.7 0.0 0.3 frn A Saturated Liquid Saturated Vapour 0.7 0.85 0.9 X 1 Mol Y 0.5 0.95 1 ooooooooo 0 0.1 0.2 0.3 0.4 0.5 0.6 0.7 0.8 6900 6200 5700 4900 4600 4000 3800 3500 3200 3000 2800 15600 15100 15000 14600 14100 13800 13400 12800 12100 11400 9700 0.9 1
Step by Step Solution
There are 3 Steps involved in it

Get step-by-step solutions from verified subject matter experts