

Question: Use graphical sensitivity analysis. List the decision alternatives from highest expected value to lowest when the probability of S1 is 44%. States of Nature
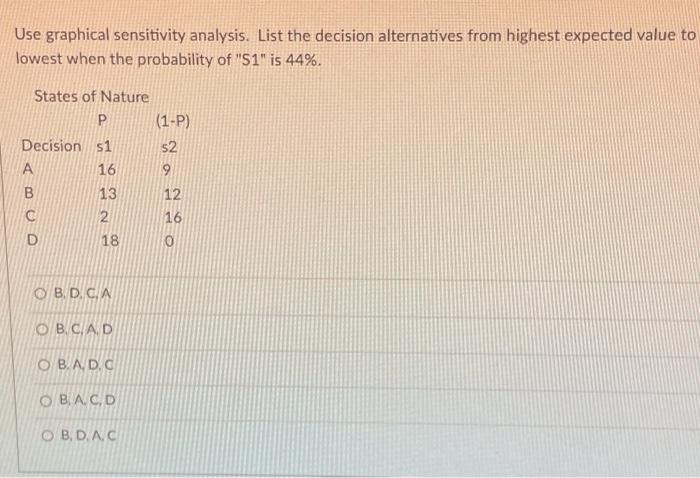
Use graphical sensitivity analysis. List the decision alternatives from highest expected value to lowest when the probability of "S1" is 44%. States of Nature P (1-P) Decision s1 s2 A 16 13 12 16 18 O B. D. C. A OB.C.A.D O B.A, D.C O B.A. C, D O B, D. A, C
Step by Step Solution
★★★★★
3.40 Rating (163 Votes )
There are 3 Steps involved in it
1 Expert Approved Answer
Step: 1 Unlock

Solution The decision alternatives from highest expected value to lowest is BACD as observed ... View full answer
Question Has Been Solved by an Expert!
Get step-by-step solutions from verified subject matter experts
Step: 2 Unlock
Step: 3 Unlock