

Question: Use graphical sensitivity analysis to determine the range of values of the probablity of state of nature s, over which each of the decision aiternatives
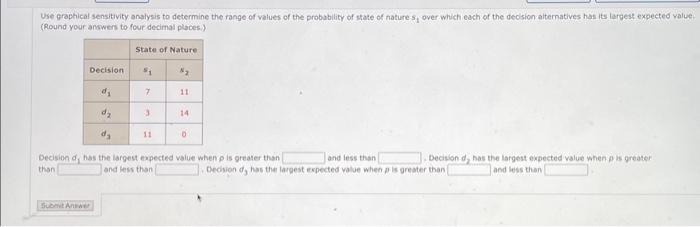
Use graphical sensitivity analysis to determine the range of values of the probablity of state of nature s, over which each of the decision aiternatives has its largest expected value. (Round your anowers to four decimal places) Decision d1 has the largest expected value when p is greater than and less than 1. Decision d2 nas the largest expected value when is greater than and lew than . Decision d3 has the largest expected valve when p is grester than and less than
Step by Step Solution
There are 3 Steps involved in it
1 Expert Approved Answer
Step: 1 Unlock

Question Has Been Solved by an Expert!
Get step-by-step solutions from verified subject matter experts
Step: 2 Unlock
Step: 3 Unlock