

Question: Use graphing technology, where applicable, to answer the following questions. A group of randomly chosen high school students were asked to jog on the
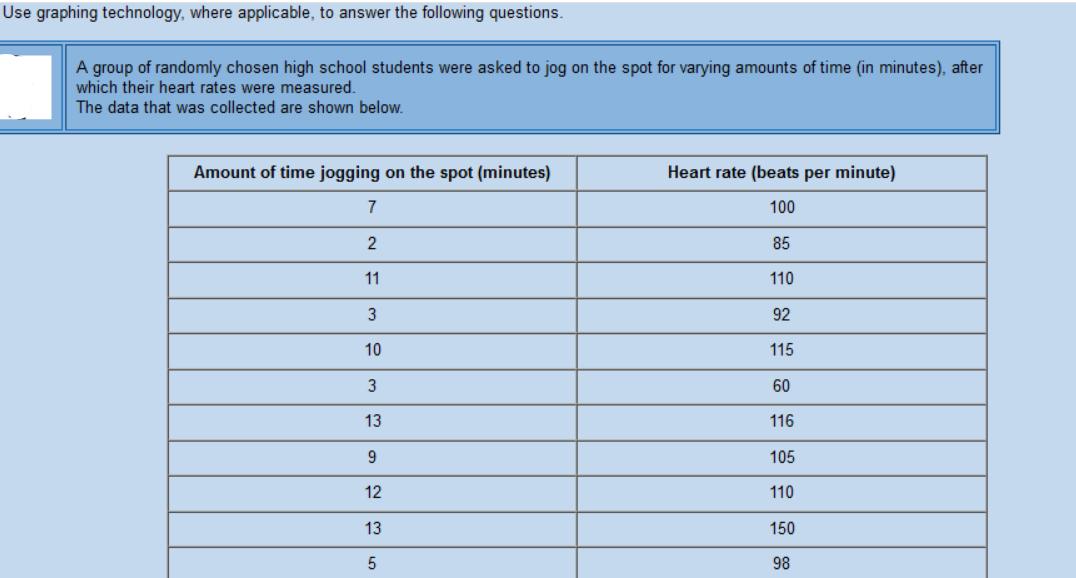
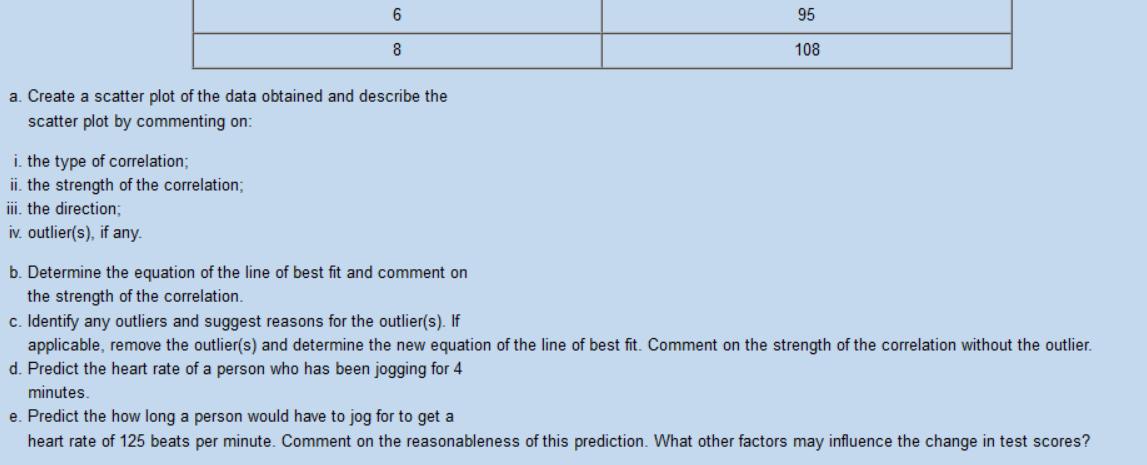
Use graphing technology, where applicable, to answer the following questions. A group of randomly chosen high school students were asked to jog on the spot for varying amounts of time (in minutes), after which their heart rates were measured. The data that was collected are shown below. Amount of time jogging on the spot (minutes) Heart rate (beats per minute) 7 100 2 85 11 110 3 92 10 115 3 60 13 116 9 105 12 110 13 150 5 98 6 8 95 108 a. Create a scatter plot of the data obtained and describe the scatter plot by commenting on: i. the type of correlation; ii. the strength of the correlation; iii. the direction; iv. outlier(s), if any. b. Determine the equation of the line of best fit and comment on the strength of the correlation. c. Identify any outliers and suggest reasons for the outlier(s). If applicable, remove the outlier(s) and determine the new equation of the line of best fit. Comment on the strength of the correlation without the outlier. d. Predict the heart rate of a person who has been jogging for 4 minutes. e. Predict the how long a person would have to jog for to get a heart rate of 125 beats per minute. Comment on the reasonableness of this prediction. What other factors may influence the change in test scores?
Step by Step Solution
There are 3 Steps involved in it

Get step-by-step solutions from verified subject matter experts