

Question: Use graphs from the Figure 7 . 2 . 1 5 from Mays book to answer the following questions: A . Calculate the depth and
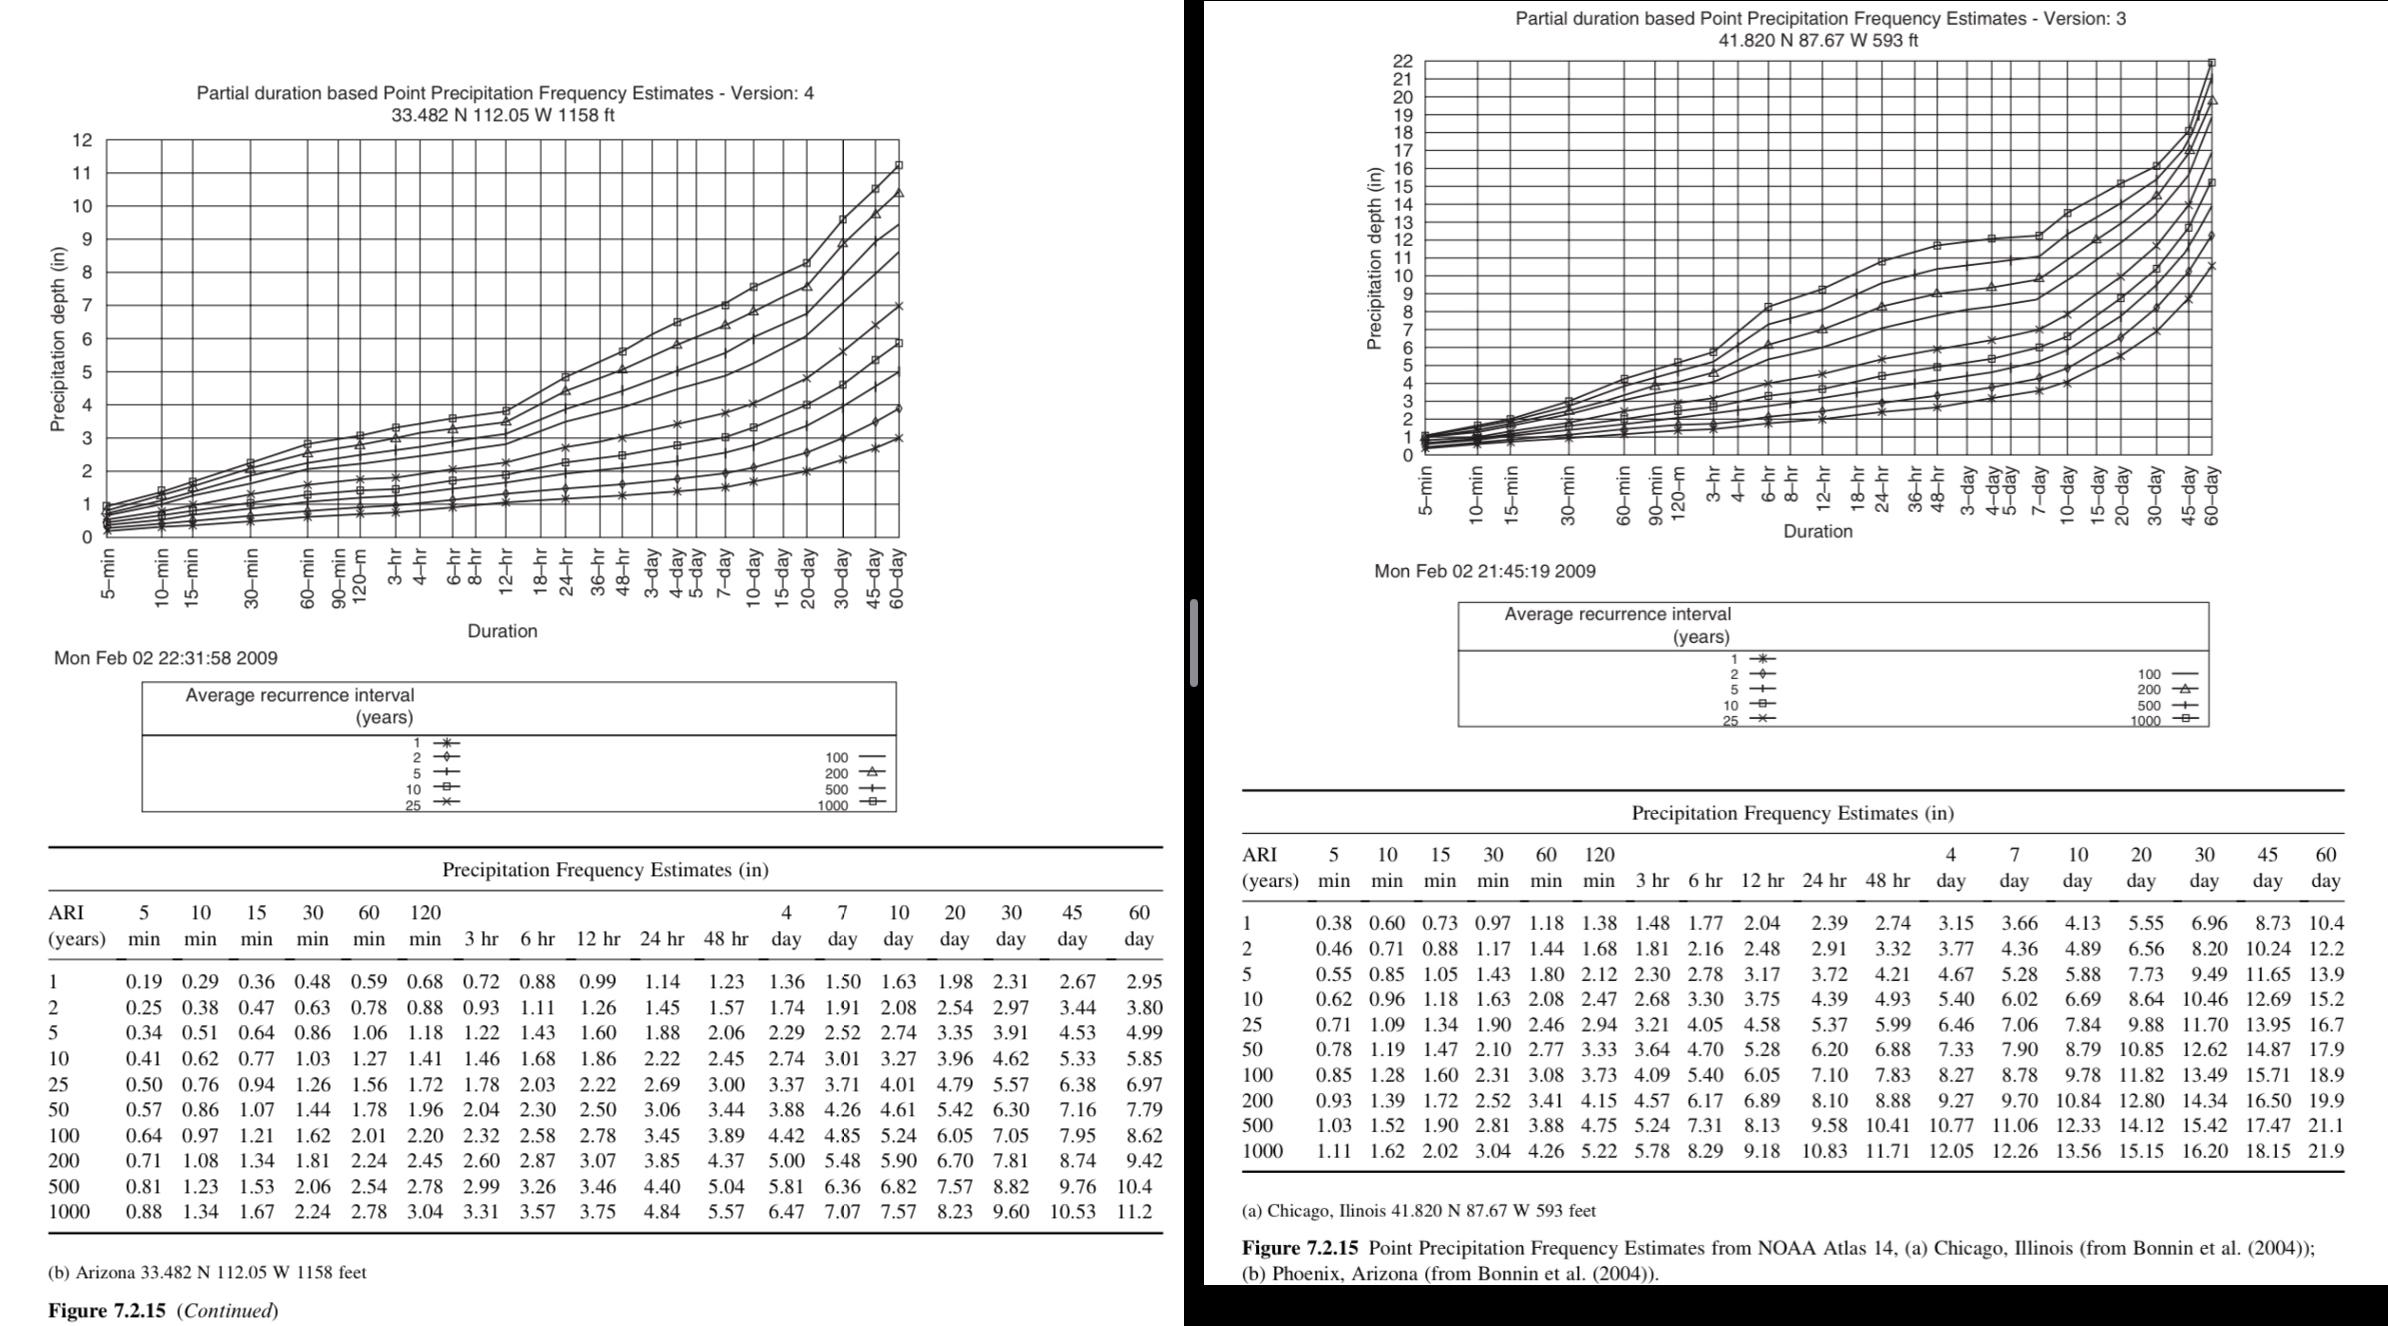
Use graphs from the Figure from Mays book to answer the following questions: A Calculate the depth and intensity of the year, hour event for Chicago, Illinois. pointB Calculate the depth and intensity of the year, hour event for Phoenix, Arizona. points Briefly discuss why are the rainfall depth estimates in A and B different?Use national design storm maps to answer the following questions. The maps for year and yearevents with minute or minute durations can be found either in Mayss Book Figure or at the following link:
https:wwwweather.govmediaowphdscdocumentsTechnicalMemoHYDROpdf
Please Google the cities below to locate them on the maps.C Calculate the depth and intensity of the year, minute event for Florida Keys. pointD Calculate the depth and intensity of the year, minute event for State College, PA points
Step by Step Solution
There are 3 Steps involved in it
1 Expert Approved Answer
Step: 1 Unlock

Question Has Been Solved by an Expert!
Get step-by-step solutions from verified subject matter experts
Step: 2 Unlock
Step: 3 Unlock