

Question: Use Jupyter Notebook Data used in Problems 1 and 2 X1 train and X2train are training data points in Class 1 and 2, respectively. Xtest
Use Jupyter Notebook
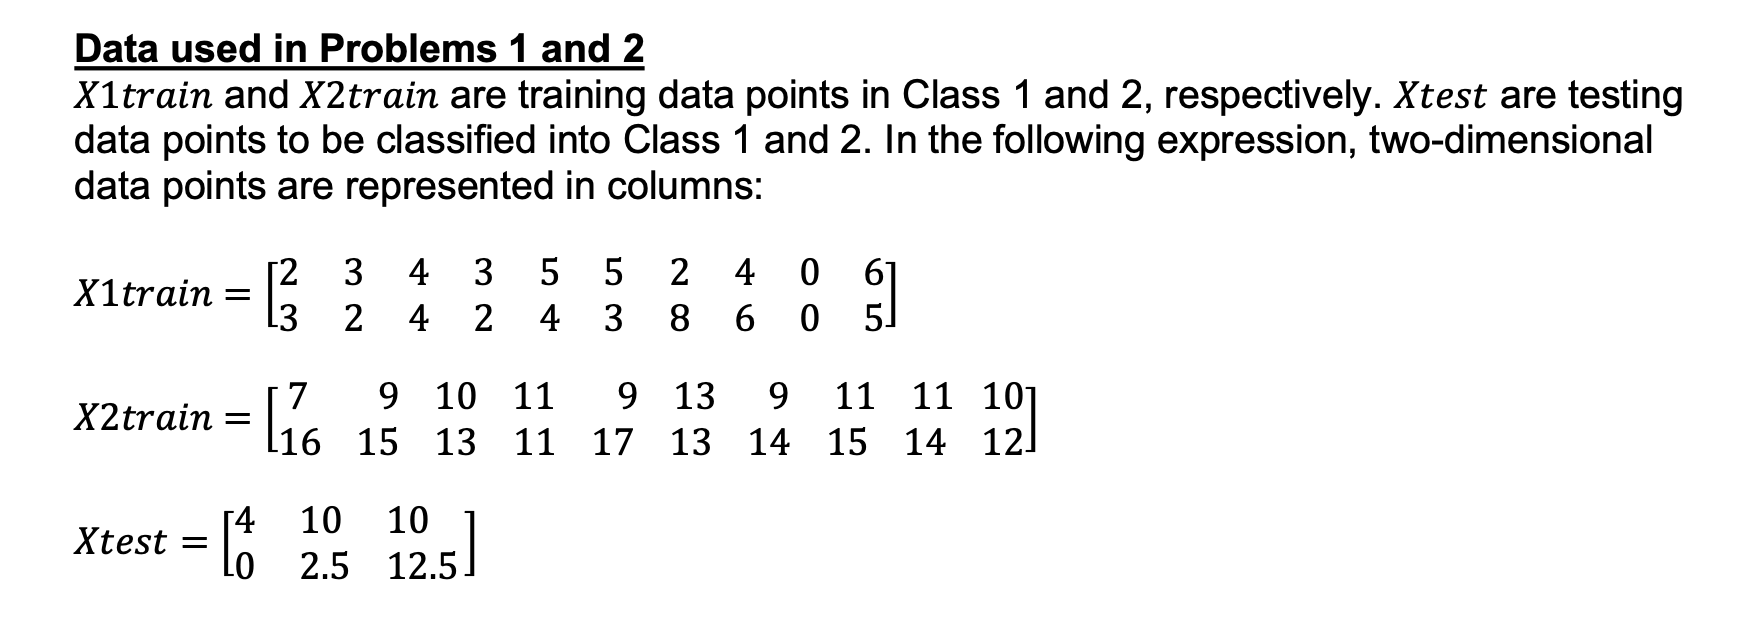
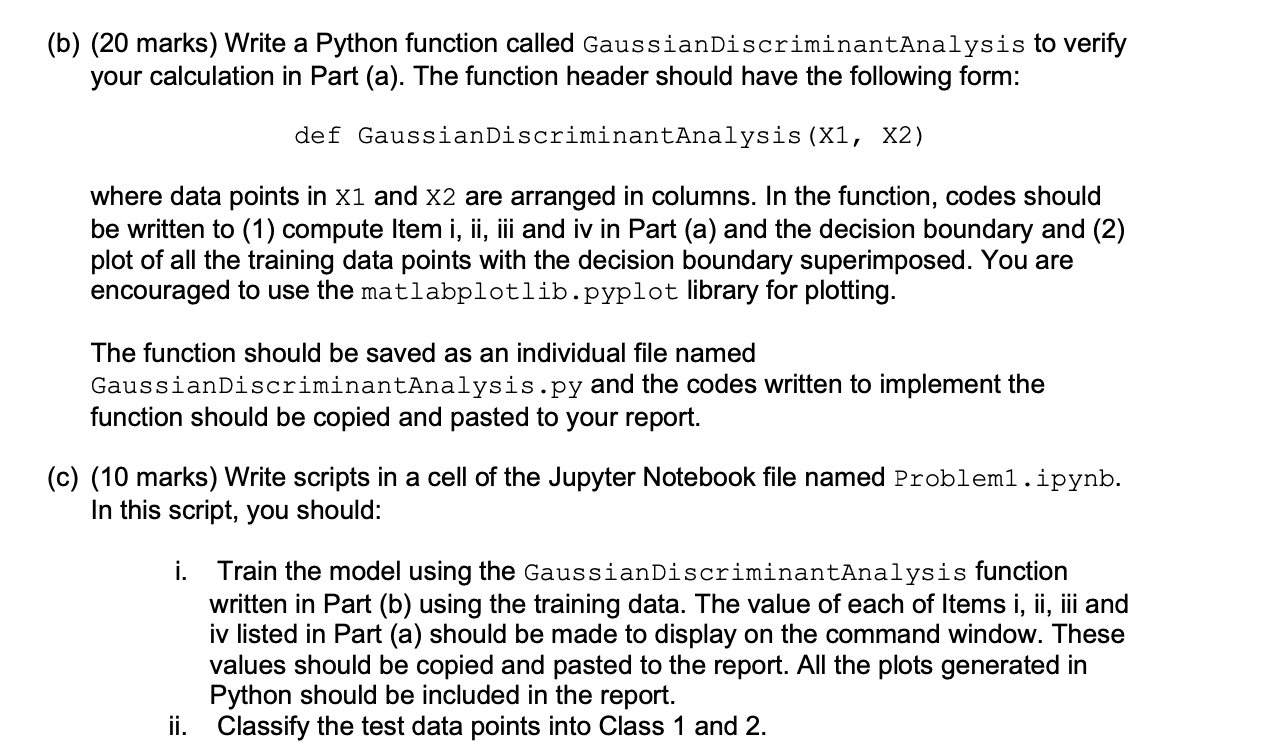
Data used in Problems 1 and 2 X1 train and X2train are training data points in Class 1 and 2, respectively. Xtest are testing data points to be classified into Class 1 and 2 . In the following expression, two-dimensional data points are represented in columns: X1train=[23324432545328460065]X2train=[716915101311119171313914111511141012]Xtest=[40102.51012.5] (b) (20 marks) Write a Python function called GaussianDiscriminantAnalysis to verify your calculation in Part (a). The function header should have the following form: def GaussianDiscriminantAnalysis (X1, X2) where data points in X1 and X2 are arranged in columns. In the function, codes should be written to (1) compute Item i, ii, iii and iv in Part (a) and the decision boundary and (2) plot of all the training data points with the decision boundary superimposed. You are encouraged to use the matlabplotlib. pyplot library for plotting. The function should be saved as an individual file named GaussianDiscriminantAnalysis.py and the codes written to implement the function should be copied and pasted to your report. (c) (10 marks) Write scripts in a cell of the Jupyter Notebook file named Problem1 . ipynb. In this script, you should: i. Train the model using the GaussianDiscriminantAnalysis function written in Part (b) using the training data. The value of each of Items i, ii, iii and iv listed in Part (a) should be made to display on the command window. These values should be copied and pasted to the report. All the plots generated in Python should be included in the report. ii. Classify the test data points into Class 1 and 2
Step by Step Solution
There are 3 Steps involved in it

Get step-by-step solutions from verified subject matter experts