

Question: Use matlab 1. Multiple functions on the same graph: a. Define t using a sequenced vector over the interval [0, 2] with a step size
Use matlab
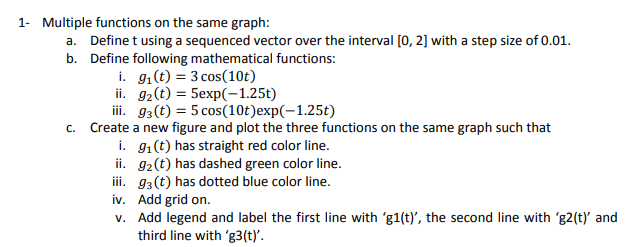
1. Multiple functions on the same graph: a. Define t using a sequenced vector over the interval [0, 2] with a step size of 0.01. b. Define following mathematical functions: i. gi(t) = 3 cos(10t) ii. 92(t) = 5exp(-1.25t) iii. 93(t) = 5 cos(10t)exp(-1.25t) C. Create a new figure and plot the three functions on the same graph such that i. 91(t) has straight red color line. ii. gz(t) has dashed green color line. iii. 93(t) has dotted blue color line. iv. Add grid on. V. Add legend and label the first line with 'g1(t)', the second line with 'g2(t) and third line with 'g3(t)
Step by Step Solution
There are 3 Steps involved in it
1 Expert Approved Answer
Step: 1 Unlock

Question Has Been Solved by an Expert!
Get step-by-step solutions from verified subject matter experts
Step: 2 Unlock
Step: 3 Unlock