

Question: USE MATLAB 3. (5 points) The table Used given below contain estimates (in individual cars) the sales volume for 12 years of data for Subaru
 USE MATLAB
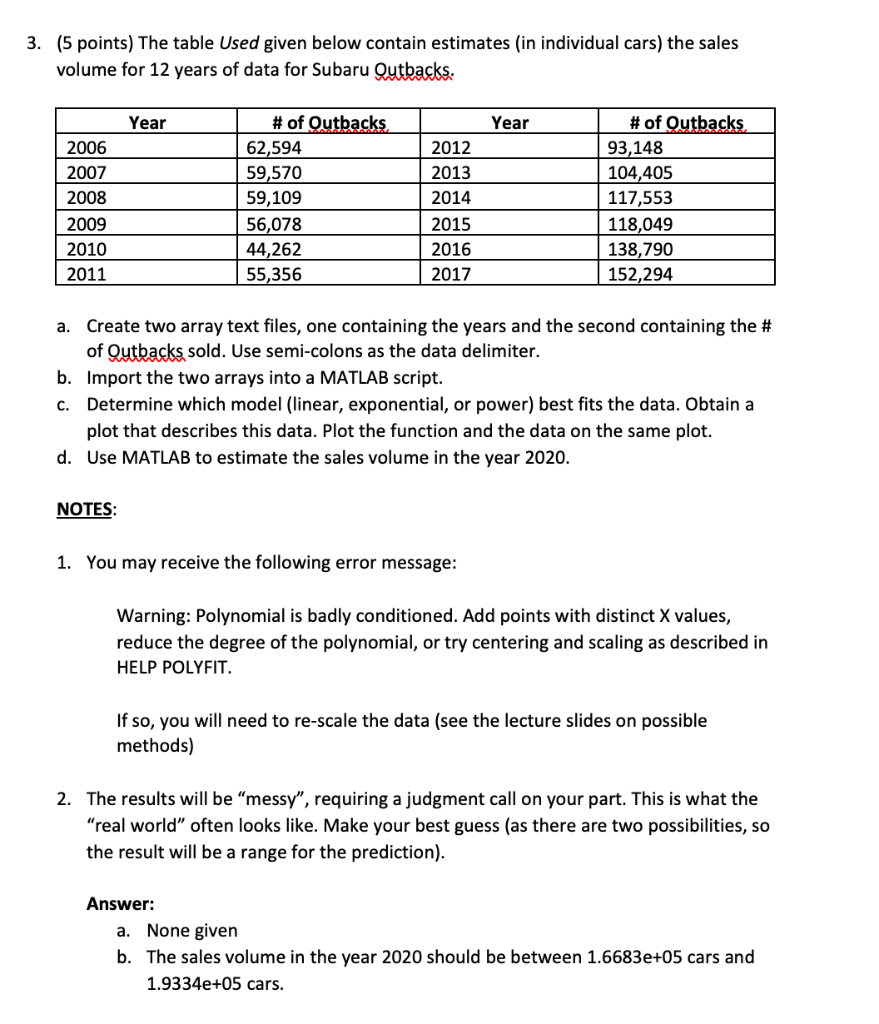
3. (5 points) The table Used given below contain estimates (in individual cars) the sales volume for 12 years of data for Subaru Qutbacks. Year Year 2006 2007 2008 2009 2010 2011 # of Outbacks 62,594 59,570 59,109 56,078 44,262 55,356 2012 2013 2014 2015 2016 2017 # of Outbacks 93,148 104,405 117,553 118,049 138,790 152,294 a. Create two array text files, one containing the years and the second containing the # of Qutbacks sold. Use semi-colons as the data delimiter. b. Import the two arrays into a MATLAB script. Determine which model (linear, exponential, or power) best fits the data. Obtain a plot that describes this data. Plot the function and the data on the same plot. d. Use MATLAB to estimate the sales volume in the year 2020. C. NOTES: 1. You may receive the following error message: Warning: Polynomial is badly conditioned. Add points with distinct X values, reduce the degree of the polynomial, or try centering and scaling as described in HELP POLYFIT. If so, you will need to re-scale the data (see the lecture slides on possible methods) 2. The results will be "messy", requiring a judgment call on your part. This is what the "real world often looks like. Make your best guess (as there are two possibilities, so the result will be a range for the prediction). Answer: a. None given b. The sales volume in the year 2020 should be between 1.6683e+05 cars and 1.9334e+05 cars. 3. (5 points) The table Used given below contain estimates (in individual cars) the sales volume for 12 years of data for Subaru Qutbacks. Year Year 2006 2007 2008 2009 2010 2011 # of Outbacks 62,594 59,570 59,109 56,078 44,262 55,356 2012 2013 2014 2015 2016 2017 # of Outbacks 93,148 104,405 117,553 118,049 138,790 152,294 a. Create two array text files, one containing the years and the second containing the # of Qutbacks sold. Use semi-colons as the data delimiter. b. Import the two arrays into a MATLAB script. Determine which model (linear, exponential, or power) best fits the data. Obtain a plot that describes this data. Plot the function and the data on the same plot. d. Use MATLAB to estimate the sales volume in the year 2020. C. NOTES: 1. You may receive the following error message: Warning: Polynomial is badly conditioned. Add points with distinct X values, reduce the degree of the polynomial, or try centering and scaling as described in HELP POLYFIT. If so, you will need to re-scale the data (see the lecture slides on possible methods) 2. The results will be "messy", requiring a judgment call on your part. This is what the "real world often looks like. Make your best guess (as there are two possibilities, so the result will be a range for the prediction). Answer: a. None given b. The sales volume in the year 2020 should be between 1.6683e+05 cars and 1.9334e+05 cars
Step by Step Solution
There are 3 Steps involved in it

Get step-by-step solutions from verified subject matter experts