

Question: Using matlab. upload your scripts and screenshot 3. The table Used given below contain estimates (in millions of dollars) the sales volume for 12 years
 Using matlab. upload your scripts and screenshot
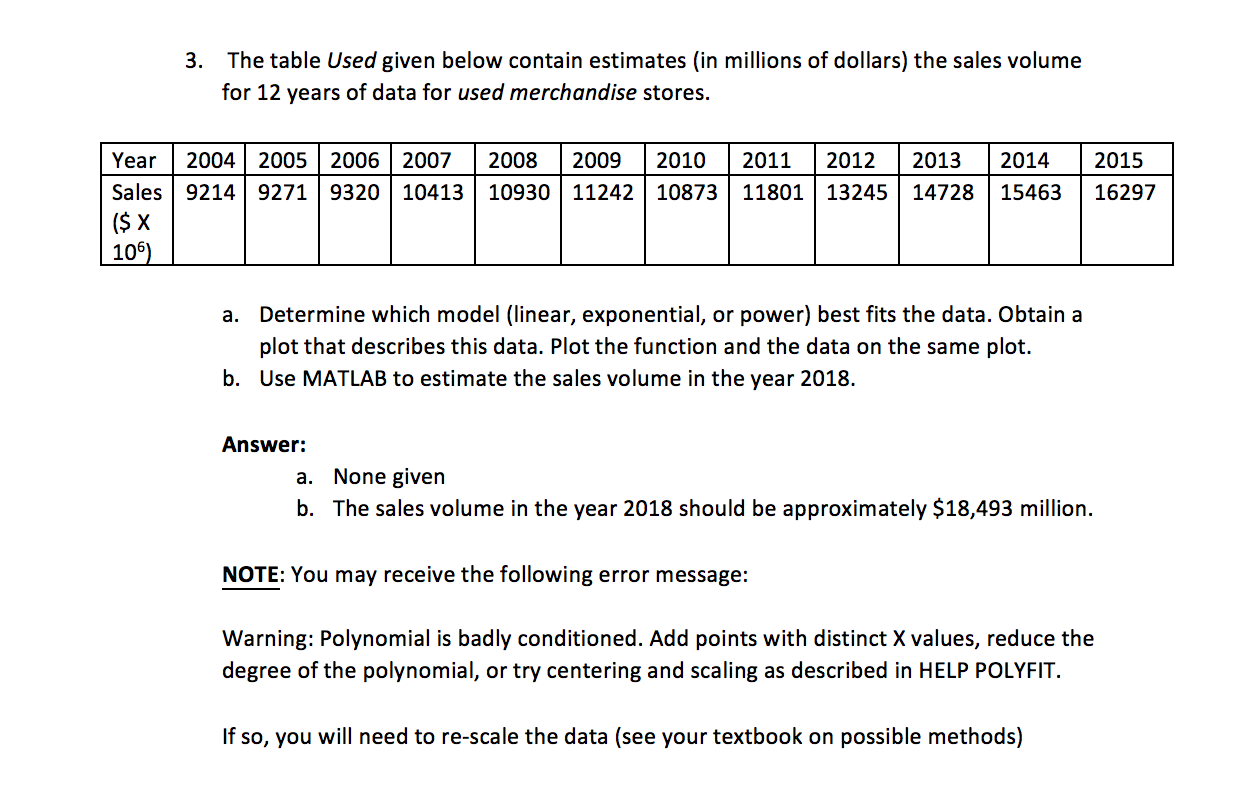
3. The table Used given below contain estimates (in millions of dollars) the sales volume for 12 years of data for used merchandise stores. | Year 2004 2005 2006 2007 Sales 9214 9271 9320 10413 ($ X 106) 2008 2009 2010 2011 2012 2013 2014 10930 11242 | 1087311801 | 13245 | 14728 15463 2015 16297 a. Determine which model (linear, exponential, or power) best fits the data. Obtain a plot that describes this data. Plot the function and the data on the same plot. b. Use MATLAB to estimate the sales volume in the year 2018. Answer: a. None given b. The sales volume in the year 2018 should be approximately $18,493 million. NOTE: You may receive the following error message: Warning: Polynomial is badly conditioned. Add points with distinct X values, reduce the degree of the polynomial, or try centering and scaling as described in HELP POLYFIT. If so, you will need to re-scale the data (see your textbook on possible methods)
Step by Step Solution
There are 3 Steps involved in it

Get step-by-step solutions from verified subject matter experts