

use Matlab and the graphs should be somewhat similar to the screenshot(2nd one) shown below). The reactor
Fantastic news! We've Found the answer you've been seeking!
Question:
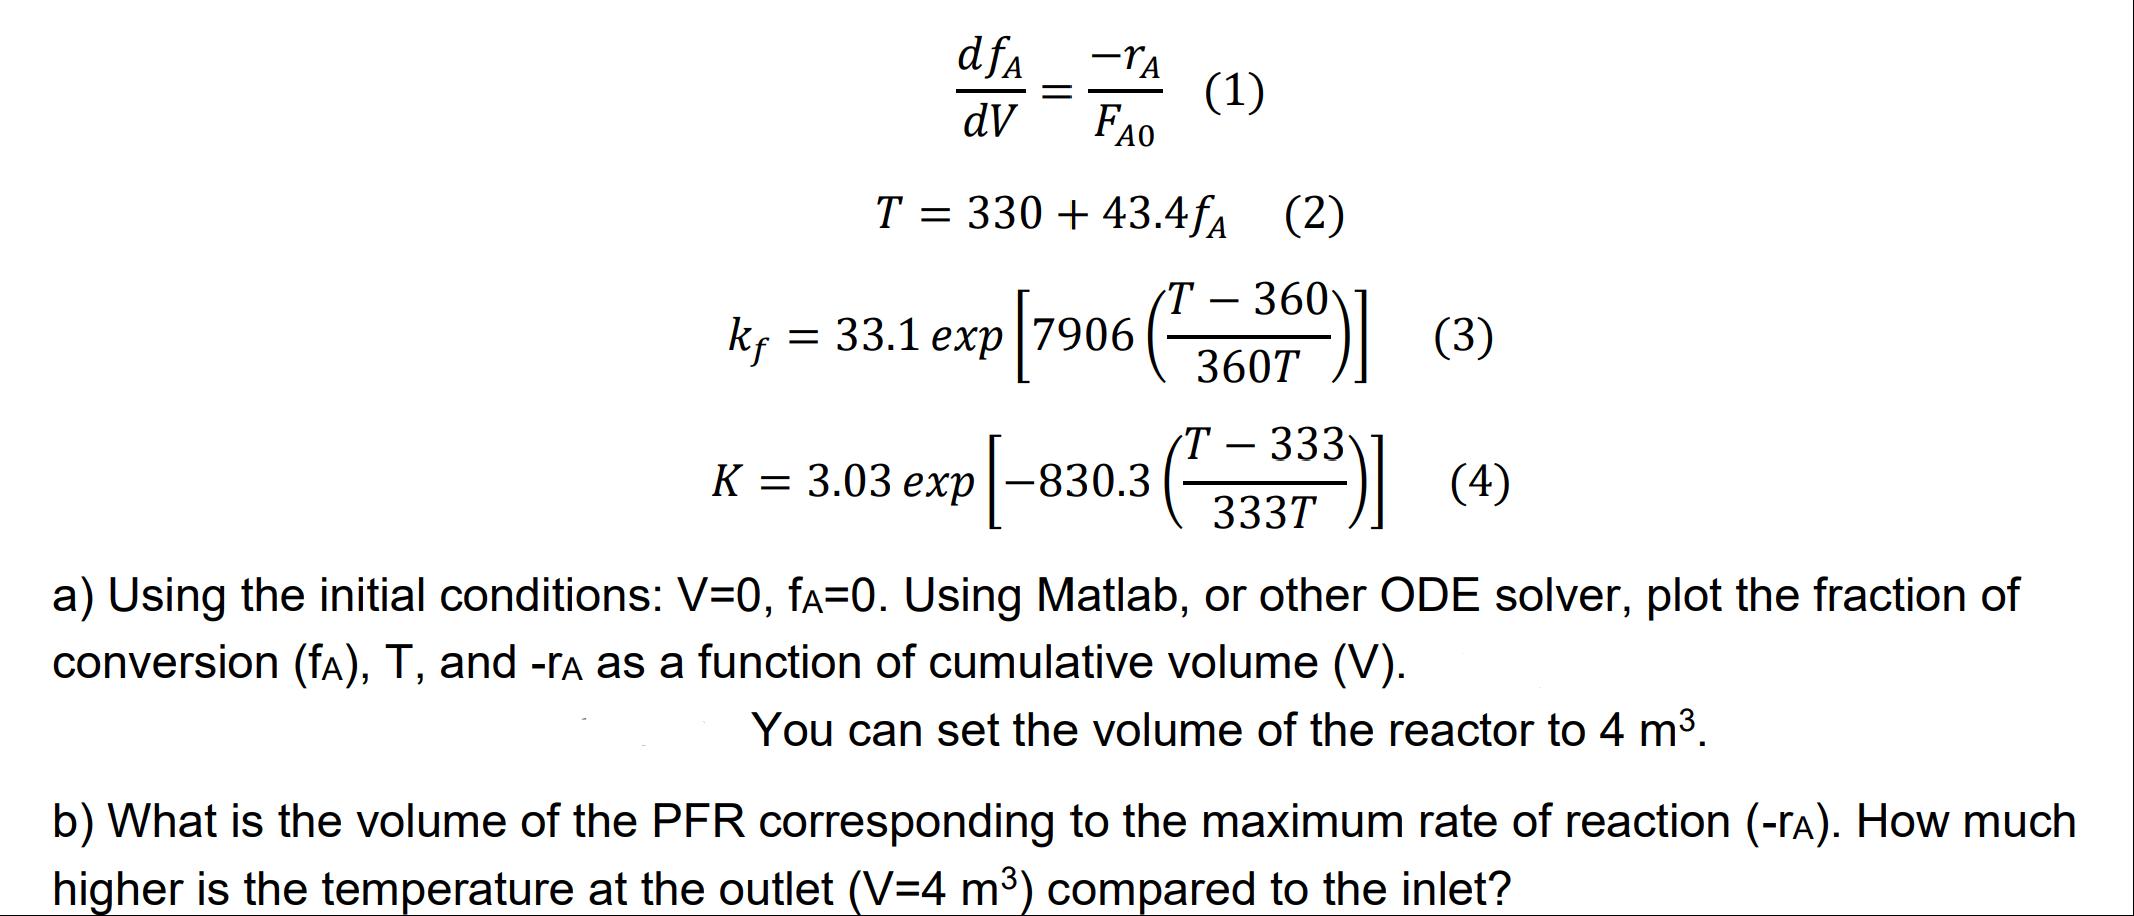
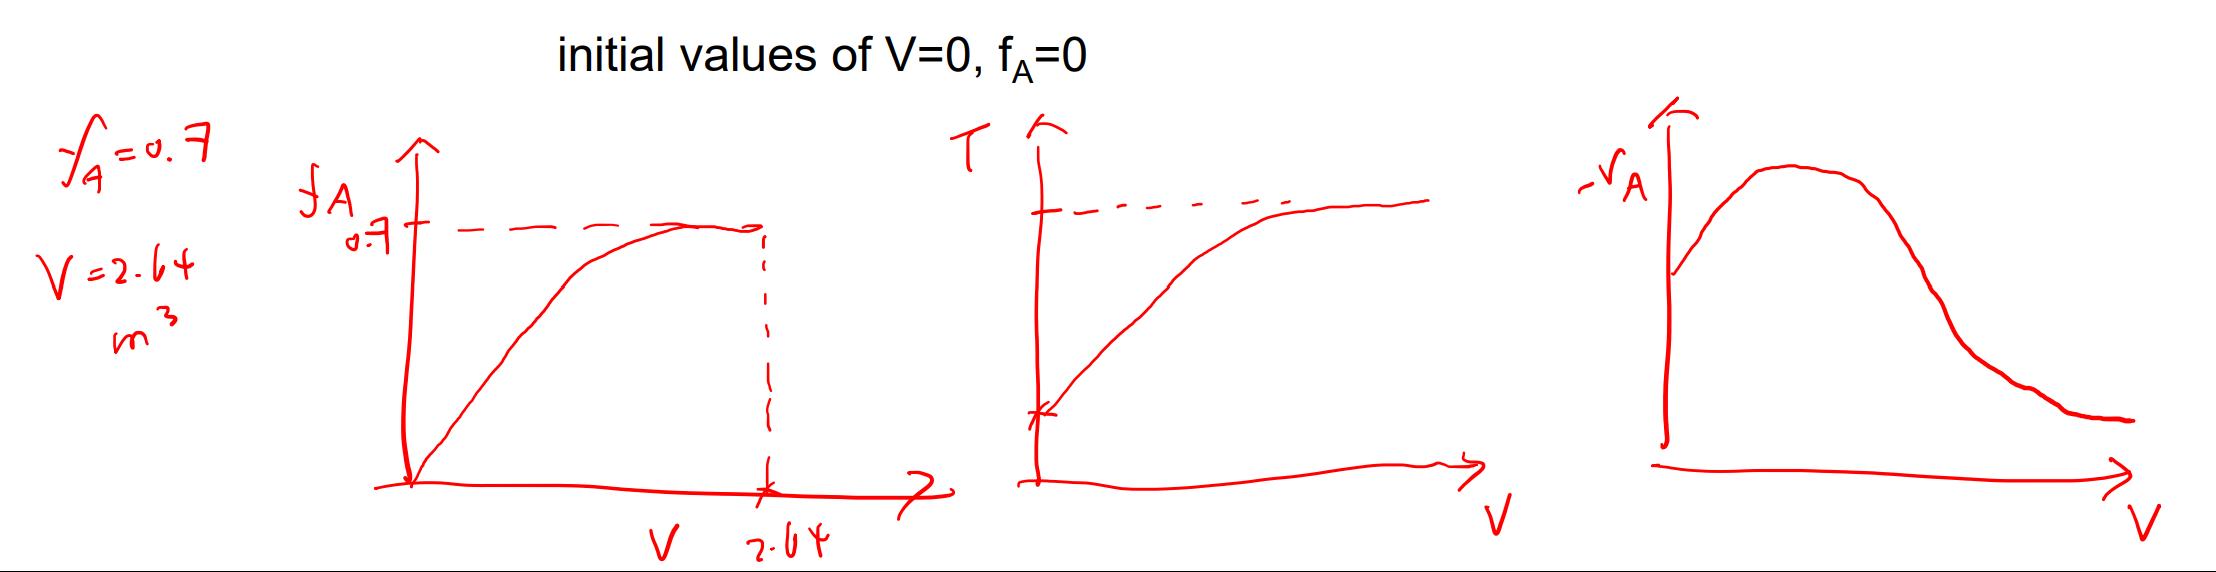
- use Matlab and the graphs should be somewhat similar to the screenshot(2nd one) shown below). The reactor temperature (T), rate constant (kf), equilibrium constant (K), and the differential form of the fraction of conversion are shown below.
Expert Answer:

Related Book For 
Applied Numerical Methods With MATLAB For Engineers And Scientists
ISBN: 9781259027437
3rd Edition
Authors: Steven C. Chapra
Posted Date:
