

Question: use MATLAB. I need the codes Q1. Plot sin(2x) and cos(x) curves from x =-10 to x =10, labelling the axes and provide a legend
 use MATLAB. I need the codes
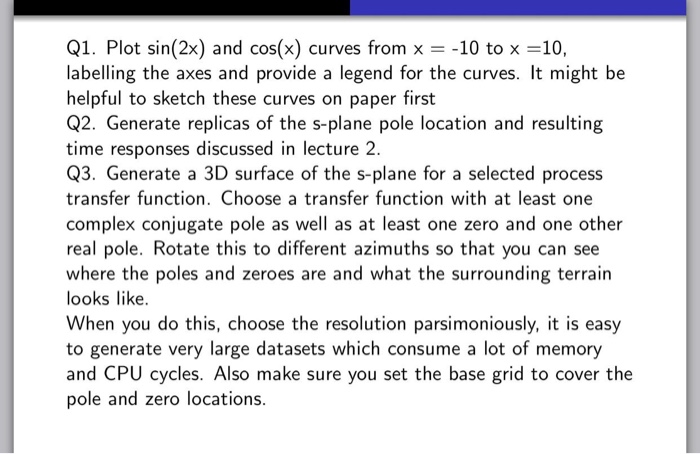
 Q1. Plot sin(2x) and cos(x) curves from x =-10 to x =10, labelling the axes and provide a legend for the curves. It might be helpful to sketch these curves on paper first Q2. Generate replicas of the s-plane pole location and resulting time responses discussed in lecture 2. Q3. Generate a 3D surface of the s-plane for a selected process transfer function. Choose a transfer function with at least one complex conjugate pole as well as at least one zero and one other real pole. Rotate this to different azimuths so that you can see where the poles and zeroes are and what the surrounding terrain looks like. When you do this, choose the resolution parsimoniously, it is easy to generate very large datasets which consume a lot of memory and CPU cycles. Also make sure you set the base grid to cover the pole and zero locations
Step by Step Solution
There are 3 Steps involved in it

Get step-by-step solutions from verified subject matter experts