

Question: Use matlab Make a surface of revolution and plot/draw it Deliverables: 1. 2. Script that does the surface creation and plotting Figure showing the profile
Use matlab
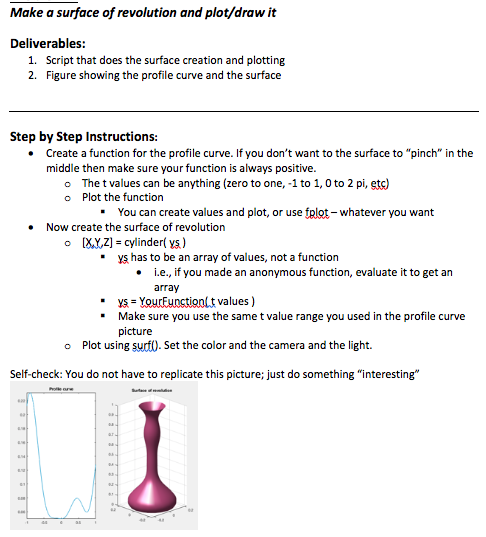
Make a surface of revolution and plot/draw it Deliverables: 1. 2. Script that does the surface creation and plotting Figure showing the profile curve and the surface Step by Step Instructions: Create a function for the profile curve. If you don't want to the surface to "pinch" in the middle then make sure your function is always positive. o The t values can be anything (zero to one, -1 to 1, 0 to 2 pi, tc) Plot the function o You can create values and plot, or use fplot whatever you want Now create the surface of revolution -ys has to be an array of values, not a function i.e., if you made an anonymous function, evaluate it to get an array . -y YourEunctionlt values ) Make sure you use the same t value range you used in the profile curve picture o Plot using surf). Set the color and the camera and the light. Self-check: You do not have to replicate this picture; just do something "interesting
Step by Step Solution
There are 3 Steps involved in it

Get step-by-step solutions from verified subject matter experts