

Question: Use matlab or octave to code. DO NOT USE if statements, while or for loops, reshape or randperm commands. Only use vectors, matrices, functions or
Use matlab or octave to code. DO NOT USE if statements, while or for loops, reshape or randperm commands. Only use vectors, matrices, functions or graph built-in functions
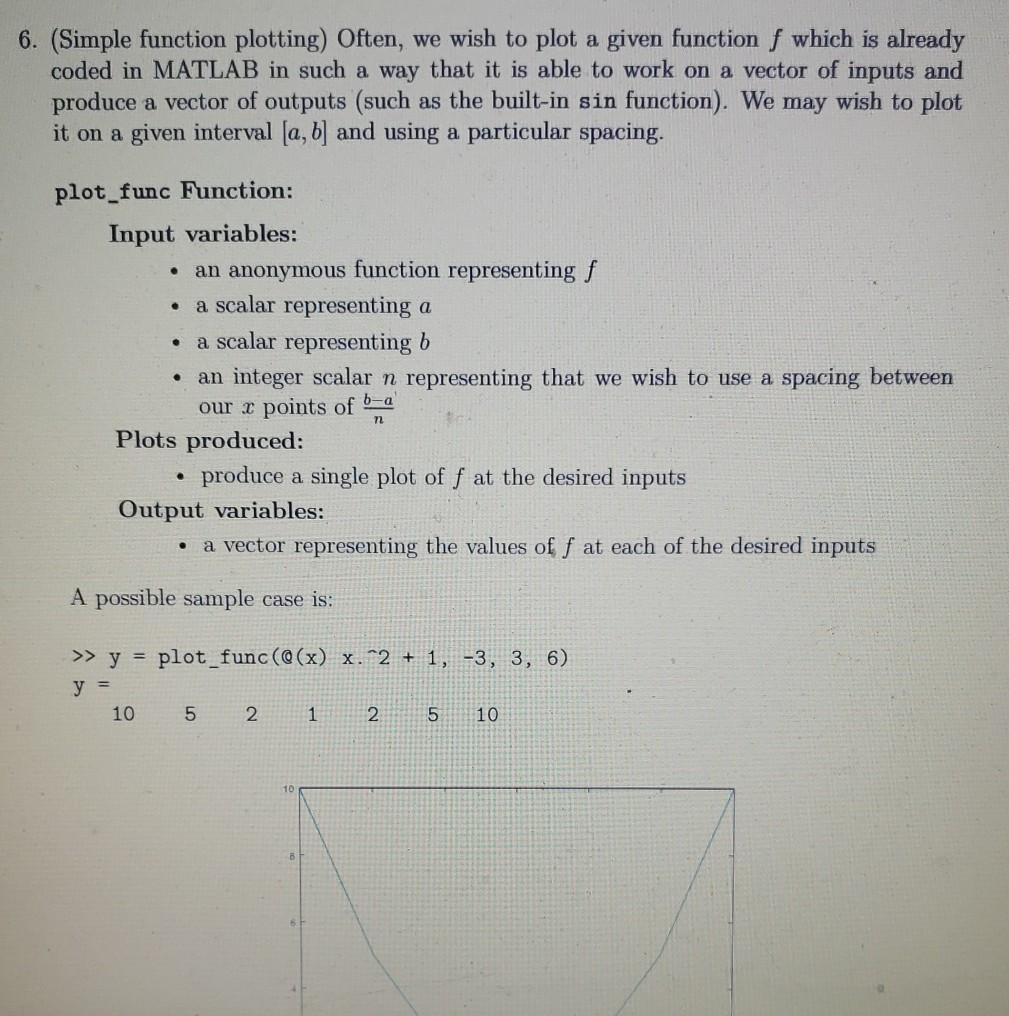
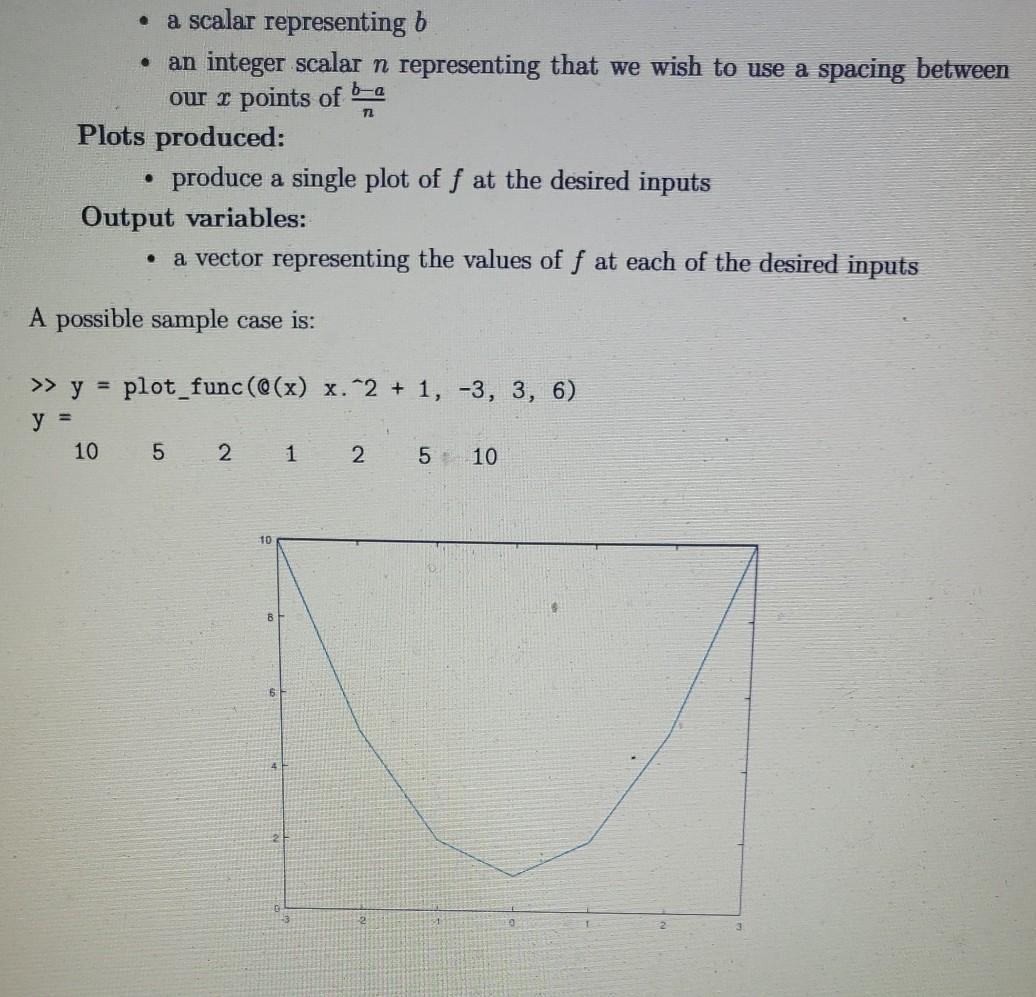
6. (Simple function plotting) Often, we wish to plot a given function f which is already coded in MATLAB in such a way that it is able to work on a vector of inputs and produce a vector of outputs (such as the built-in sin function). We may wish to plot it on a given interval [a, b] and using a particular spacing. plot_func Function: Input variables: an anonymous function representing f a scalar representing a a scalar representing b an integer scalar n representing that we wish to use a spacing between our r points of 6-2 Plots produced: produce a single plot of f at the desired inputs Output variables: a vector representing the values of f at each of the desired inputs . . A possible sample case is: >> y = plot_func(@(x) x.^2 + 1, -3, 3, 6) y = 10 5 2 1 2 5 10 . m2 a scalar representing b an integer scalar n representing that we wish to use a spacing between our x points of b-a Plots produced: produce a single plot of f at the desired inputs Output variables: a vector representing the values of f at each of the desired inputs A possible sample case is: . >> y = plot_func(@(x) x.^2 + 1, -3, 3, 6) y = 10 5 2 1 2 5 10
Step by Step Solution
There are 3 Steps involved in it

Get step-by-step solutions from verified subject matter experts