

Question: Use MATLAB Part B: Plot Replication You will now draw upon the experience you've gained in part A, to replicate Fig 1 below Shown in
Use MATLAB
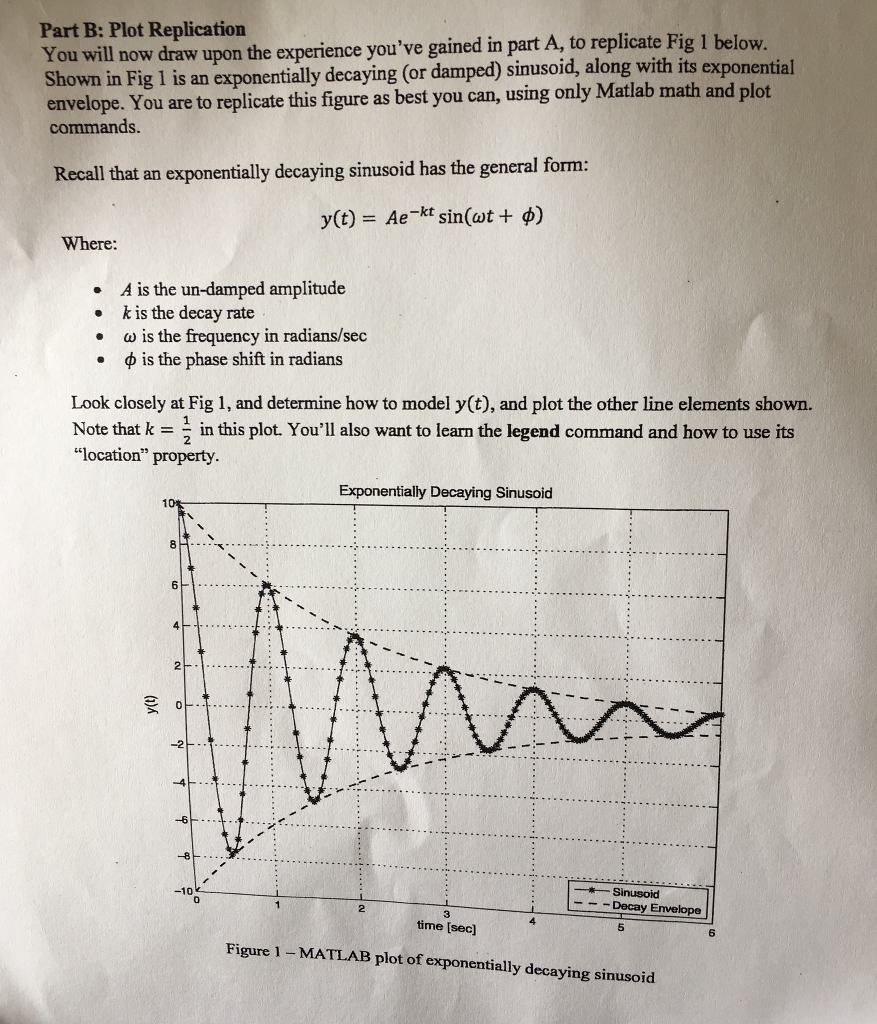
Part B: Plot Replication You will now draw upon the experience you've gained in part A, to replicate Fig 1 below Shown in Fig 1 is an exponentially decaying (or damped) sinusoid, along with its exponential envelope. You are to replicate this figure as best you can, using only Matlab math and plot commands Recall that an exponentially decaying sinusoid has the general form: y(t) Ae-kt sin( t + ?) Where: A is the un-damped amplitude k is the decay rate . is the frequency in radians/sec o is the phase shift in radians . Look closely at Fig 1, and determine how to model y(t), and plot the other line elements shown. Note that k = 2 in this plot. You'll also want to learn the legend command and how to use its "location" property. Exponentially Decaying Sinusoid 2 -2 -10 0 2 Decay Envelope time [sec] 6 Figure 1 - MATLAB plot of exponentially decaying sinusoid
Step by Step Solution
There are 3 Steps involved in it

Get step-by-step solutions from verified subject matter experts