

Question: Use Matlab, please dont copy from other posts they are wrong. A sine wave function g(t) is linearly increasing in frequency from 0 Hz at
Use Matlab, please dont copy from other posts they are wrong. 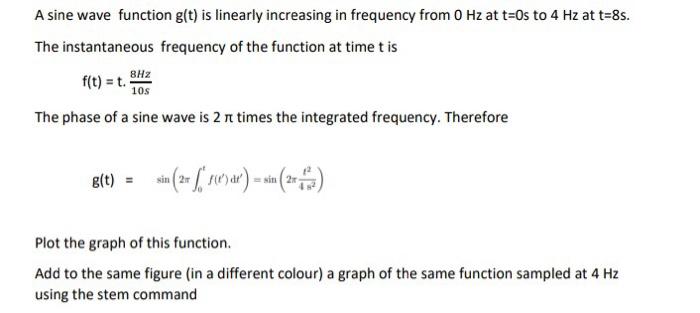
A sine wave function g(t) is linearly increasing in frequency from 0 Hz at t=0s to 4 Hz at t=85. The instantaneous frequency of the function at time tis 8HZ f(t) = t. The phase of a sine wave is 2 rt times the integrated frequency. Therefore 105 8(t) = sin(2* [svar) - (2-0) ' Plot the graph of this function. Add to the same figure (in a different colour) a graph of the same function sampled at 4 Hz using the stem command
Step by Step Solution
There are 3 Steps involved in it
1 Expert Approved Answer
Step: 1 Unlock

Question Has Been Solved by an Expert!
Get step-by-step solutions from verified subject matter experts
Step: 2 Unlock
Step: 3 Unlock