

Question: question: using Matlab The problem when I type in the code: Can you please use matlab and post the code used with the images to
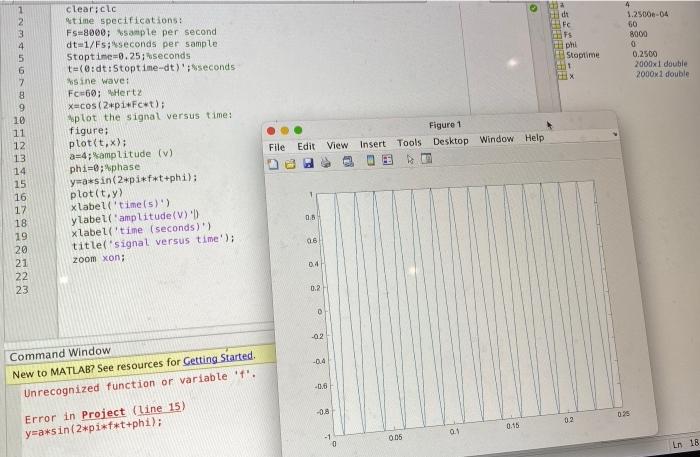
A sine wave function g(t) is linearly increasing in frequency from 0 Hz at t=0s to 4 Hz at t=8s. The instantaneous frequency of the function at time tis 8H2 f(t) = t. 105 The phase of a sine wave is 2 rt times the integrated frequency. Therefore 8(t) 2 sin (2+ ) de') --in (2) Plot the graph of this function. Add to the same figure (in a different colour) a graph of the same function sampled at 4 Hz using the stem command 1 2 CUT AWN Ft FC Fs phi Stoptime 1 TED 4 1.2500-04 60 8000 0 0.2500 2000x1 double 2000x1 double clear:cic time specifications: Fs=8000; sample per second dt=1/Fs;seconds per sample Stoptime=0.25;seconds te:dt:Stoptime-dt'inseconds sine wave: Fc 60; Hertz Xacos (2*1*Fcwt); plot the signal versus time: figure; plot(t, x); a4; amplitude (v) phi=0; phase y=a+s in ( 24p 1+ f 4t+phi) plot(t,y) xlabel('time(s)) ylabel('amplitude() xlabel('tine (seconds) title('signal versus time); zoom xon; File Figure 1 Edit View Insert Tools Desktop Window Help a 10 11 12 13 14 15 16 17 18 19 20 21 22 23 3 0.5 06 0.4 0.2 D -02 -0.4 Command Window New to MATLAB? See resources for Getting Started Unrecognized function or variable 'f'. -0.6 -0.8 02 02 Error in Project (line 15) yaxsin(2*1*f*t+phi); 0.15 01 -1 0 005 18
Step by Step Solution
There are 3 Steps involved in it

Get step-by-step solutions from verified subject matter experts