

Question: Use MATLAB please with screenshots Task 1. MATI AB (5 points each 35 points in total) We will build upon our previous MATLAB experience in
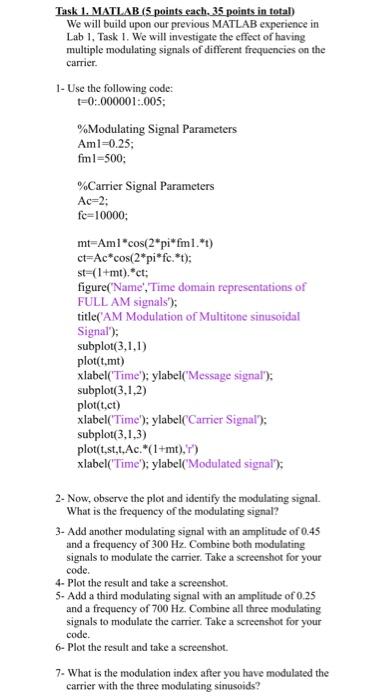
Task 1. MATI AB (5 points each 35 points in total) We will build upon our previous MATLAB experience in Lab 1. Task 1. We will investigate the effect of having multiple modulating signals of different frequencies on the carrier. 1- Use the following code: t=0:000001:005 % Modulating Signal Parameters Am1=0.25fmm=500 % Carrier Signal Parameters Ac=2;fc=10000; mt=Am1cos(2pifmlt)ct=Accos(2piifct)st=(1+mt).ct; figure( Name', Time domain representations of FULL AM signais ); title('AM Modulation of Multitone sinusoidal Signal"); subplot (3,1,1) plot( t,mt) xlabel('Time'); ylabel('Message signal'); subplot( 3,1,2) plot(t,ct) xlabel('Time'); ylabel('Carrier Signal'); subplot (3,1,3) plot(t,st,t, Ac. * (1+mt),rt) xlabel('Time'); ylabel('Modulated signal'); 2- Now, observe the plot and identify the modulating signal. What is the frequency of the modulating signal? 3- Add another modulating signal with an amplitude of 0.45 and a frequency of 300Hz. Combine both modulating signals to modulate the carrier. Take a screenshot for your code. 4- Plot the result and take a screenshot. 5- Add a third modulating signal with an amplitude of 0.25 and a frequency of 700Hz. Combine all three modulating signals to modulate the carrier. Take a sereenshot for your code. 6- Plot the result and take a screenshot. 7. What is the modulation index after you have modulated the carrier with the three modulating sinusoids
Step by Step Solution
There are 3 Steps involved in it

Get step-by-step solutions from verified subject matter experts