

Question: Use MATLAB Simulink : A district heating plant is producing heat and electricity by burning coal. Their consumption of coal is currently 100 ton/h. Fixed
Use MATLAB Simulink:
A district heating plant is producing heat and electricity by burning coal. Their consumption of coal is currently 100 ton/h. Fixed costs of running the plant are 2500 EUR/h. The price of coal is 120 EUR/ton containing 6150 kWh/ton of energy. The efficiency of turbine converting thermal energy to electricity is 40% and 50% out of the remaining energy is sold to district heating network. The price of sold electricity is 4.0 EUR/kWh and the price of heat energy is approximated to be 1.0 EUR/kWh. Use the above mentioned constant variables to draw function block diagrams (*) on:
a) Production sub-model including:
(i) 1p Electricity production (kWh/h)
(ii) 1p Heat production (kWh/h)
b) Cash flow calculation sub-model, which calculates the
(iii) 1p Cumulating revenue (costs deducted, EUR/h) over time. Use routing of signals from the production sub-model in (i) & (ii)
(iv) 1p Cash balance. Assumed that the initial cash balance is set to 50 000 EUR
c) Assume that the price of electricity is variable. During the last 12 hours the prices have been as follows 4.024, 4.245, 4.436, 4.110, 4.092, 4.109, 4.062, 4.114, 4.046, 3.984, 3.987, 3.999
(i) 1p Describe, what are the operation(s) that you have to do in order to input this electricity price data in to the model sketched in 4a/b. What are the possible data pre-processing steps / cleaning etc. and what type(s) of Simulink-blocks would you use?
(ii) 2p In the block diagram(s) of 4a/b implement a change that reduces the amount of electricity production by 50% (and heat production as a result), if the price of electricity drops below 4 EUR/kWh (you can use dashed lines to indicate the modification in the diagram). For simplicity, assume that once stopped, the fixed costs of running the plant remain do not change. Provide code(s) as needed
(*): Examples of function block diagram symbols from Matlab Simulink are shown below. You are not assumed to remember the symbol shapes, so prefer writing operation below each block for clarity as shown below.
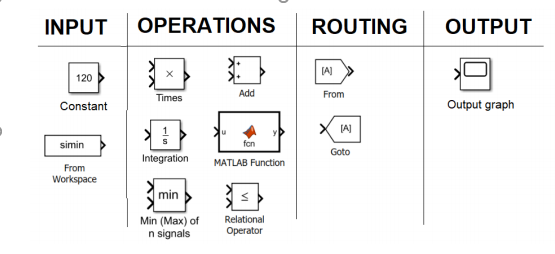
(*): Examples of function block diagram symbols from Matlab Simulink to be used. Also, prefer writing the description of the operation below each block in your answer (e.g. gross income, unit cost of , etc.)
INPUT OPERATIONS ROUTING OUTPUT (A) 120 Add Times From Constant Output graph TAI simin fon Goto Integration From MATLAB Function Workspace min Min (Max) of n signals Relational Operator INPUT OPERATIONS ROUTING OUTPUT (A) 120 Add Times From Constant Output graph TAI simin fon Goto Integration From MATLAB Function Workspace min Min (Max) of n signals Relational Operator
Step by Step Solution
There are 3 Steps involved in it

Get step-by-step solutions from verified subject matter experts