

Question: Use MATLAB to answer these questions. Q3. Use the plot command to plot the function fx) -10 x+2 for 0x35. Q4 1.5 The shape of
Use MATLAB to answer these questions.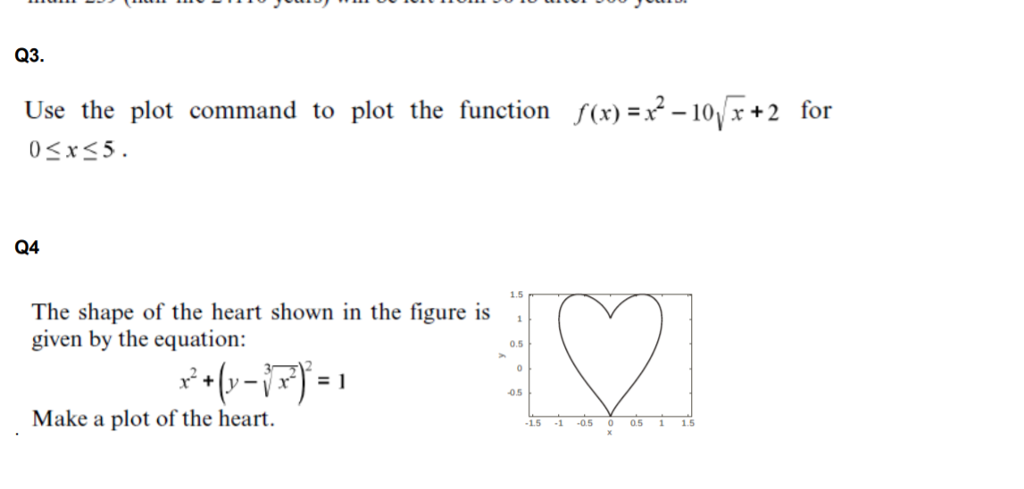
Q3. Use the plot command to plot the function fx) -10 x+2 for 0x35. Q4 1.5 The shape of the heart shown in the figure is given by the equation: 0.5 0.5 Make a plot of the heart. 15 -1 0.5 05 115
Step by Step Solution
There are 3 Steps involved in it
1 Expert Approved Answer
Step: 1 Unlock

Question Has Been Solved by an Expert!
Get step-by-step solutions from verified subject matter experts
Step: 2 Unlock
Step: 3 Unlock