

Question: Use Matlab to create a script called myCurveFittingScript.m that applies a linear, quadratic, cubic, and exponential least square regressions to the following x and y
Use Matlab to create a script called myCurveFittingScript.m that applies a linear, quadratic, cubic, and exponential least square regressions to the following x and y data poits. Your script should plot the data points as Xs and fits as solid lines.
Please I need this solved immediately for exam. EMERGENGY!!! Thank you.
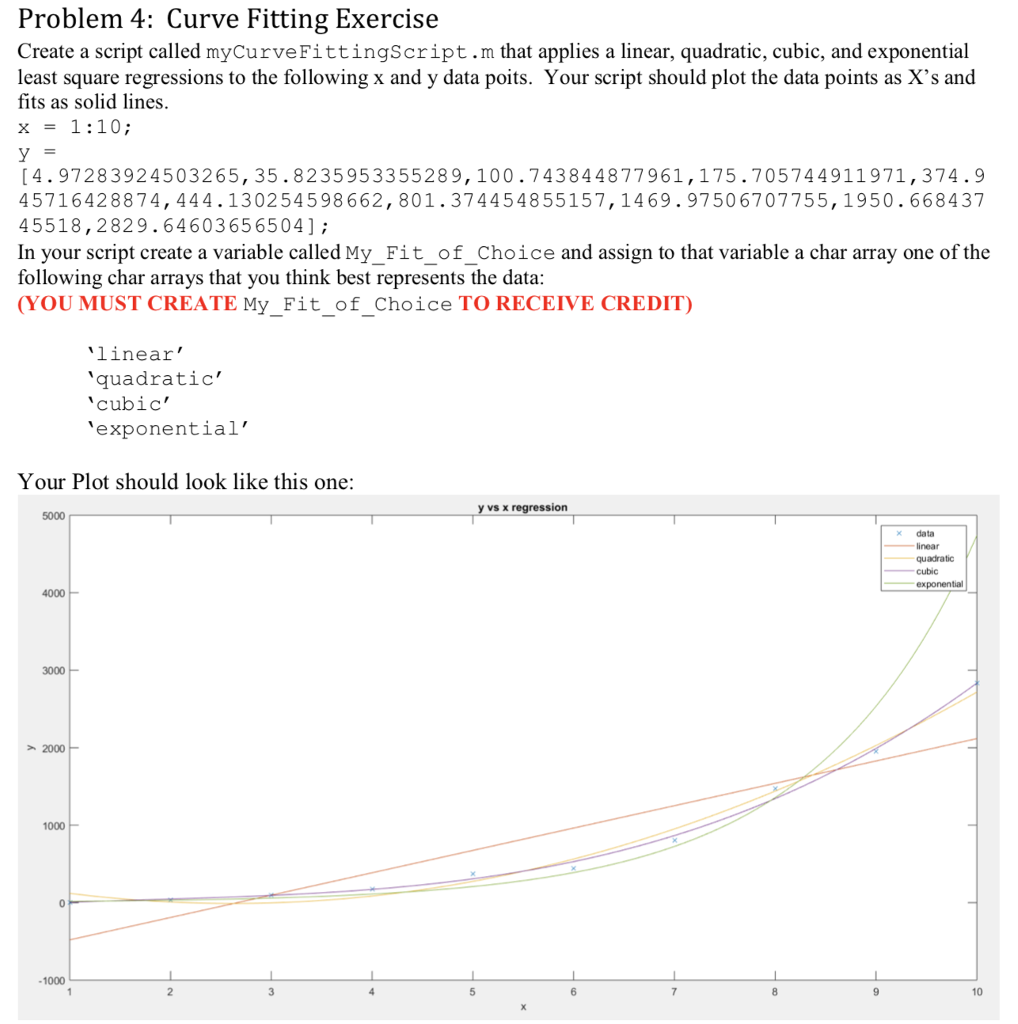
Problem 4: Curve Fitting Exercise Create a script called myCurveFittingScript.m that applies a linear, quadratic, cubic, and exponential least square regressions to the following x and y data poits. Your script should plot the data points as X's and fits as solid lines. x = 1:10; [4.97283924503265, 35.8235953355289,100.743844877961,175.705744911971,374.9 45716428874, 444.130254598662, 801.374454855157,1469.97506707755,1950.668437 45518,2829.64603656504]; In your script create a variable called My Fit of Choice and assign to that variable a char array one of the following char arrays that you think best represents the data (YOU MUST CREATE My_Fit_of_Choice TO RECEIVE CREDIT linear' quadratic' cubic exponential' Your Plot should look like this one: y vs x regression x data linear 2000 1000 1000 2 10 Problem 4: Curve Fitting Exercise Create a script called myCurveFittingScript.m that applies a linear, quadratic, cubic, and exponential least square regressions to the following x and y data poits. Your script should plot the data points as X's and fits as solid lines. x = 1:10; [4.97283924503265, 35.8235953355289,100.743844877961,175.705744911971,374.9 45716428874, 444.130254598662, 801.374454855157,1469.97506707755,1950.668437 45518,2829.64603656504]; In your script create a variable called My Fit of Choice and assign to that variable a char array one of the following char arrays that you think best represents the data (YOU MUST CREATE My_Fit_of_Choice TO RECEIVE CREDIT linear' quadratic' cubic exponential' Your Plot should look like this one: y vs x regression x data linear 2000 1000 1000 2 10
Step by Step Solution
There are 3 Steps involved in it

Get step-by-step solutions from verified subject matter experts