

Question: Use MATLAB to plot a table Given a database with the name of 54 citys, and their solar energy, preciptation, and wind speed of twelve
Use MATLAB to plot a table
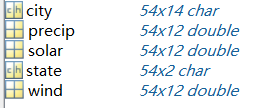
Given a database with the name of 54 citys, and their solar energy, preciptation, and wind speed of twelve months(ignore the state)
the data is in this google drive link:https://drive.google.com/open?id=0B5h9dD4UrVkyV1RfbEIwLVNmZms
city is the name of 54 cities, precip,solar,and wind are for 12 months, just sum(solar,2) to get the annual amount and then sort.
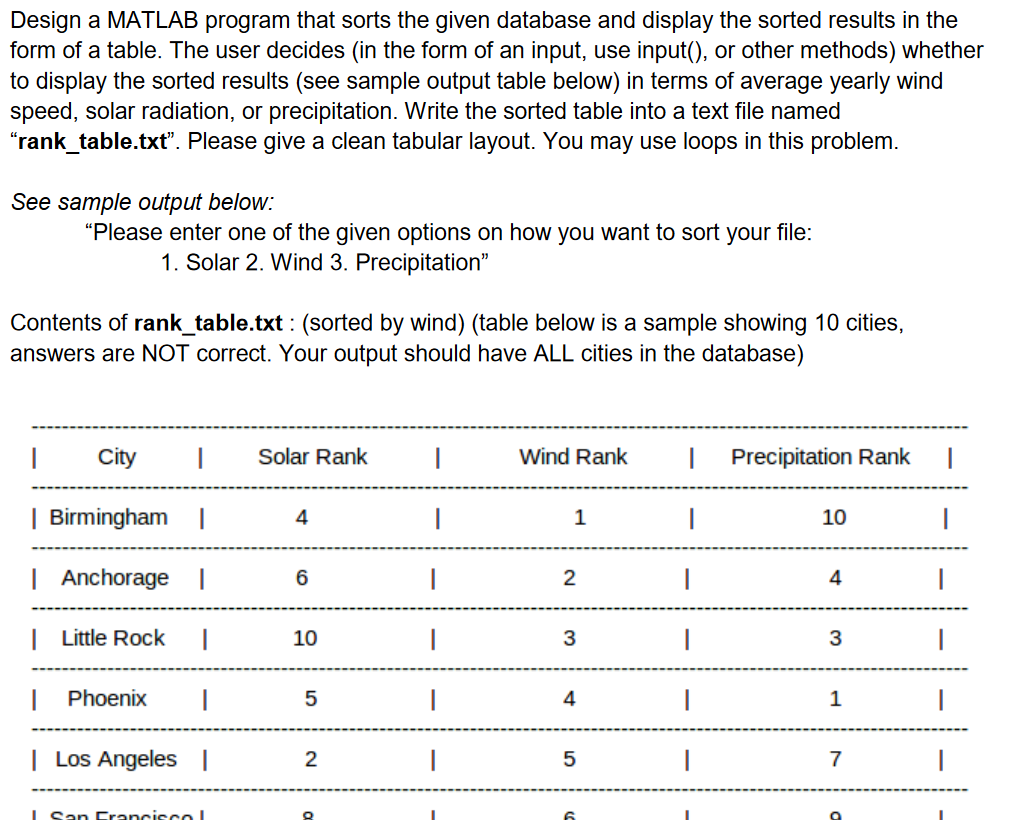
the problem is as followed
city EE precip solar State wind 54x14 char 54x12 double 54x12 double 54x2 char 54x12 double city EE precip solar State wind 54x14 char 54x12 double 54x12 double 54x2 char 54x12 double
Step by Step Solution
There are 3 Steps involved in it
1 Expert Approved Answer
Step: 1 Unlock

Question Has Been Solved by an Expert!
Get step-by-step solutions from verified subject matter experts
Step: 2 Unlock
Step: 3 Unlock