

Question: Use MATLAB to plot the following functions: y_1(t) = [u(t) - u(t - 1)] y_2(t) = [u(t - 1) - u(t - 2)] y_3(t) =
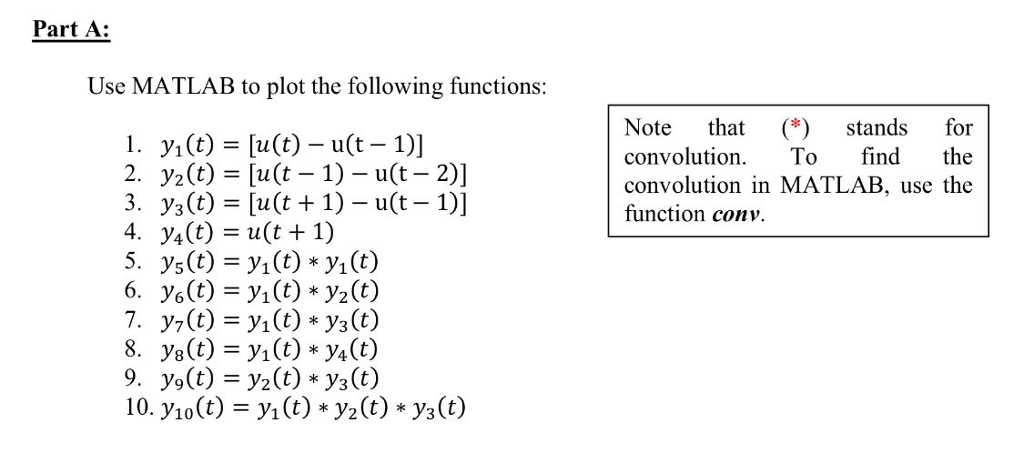
Use MATLAB to plot the following functions: y_1(t) = [u(t) - u(t - 1)] y_2(t) = [u(t - 1) - u(t - 2)] y_3(t) = [u(t + 1) - u(t - 1)] y_4(t) = u(t + 1) y_5(t) = y_1(t) * y_1(t) y_6 (t) = y_1 (t) * y_2(t) y_7(t) = y_1(t) * y_3(t) y_8(t) = y_1(t) * y_4(t) y_9(t) = y_2(t)* y_3(t) y_10(t) = y_1(t) * y_2(t) * y_3(t)
Step by Step Solution
There are 3 Steps involved in it
1 Expert Approved Answer
Step: 1 Unlock

Question Has Been Solved by an Expert!
Get step-by-step solutions from verified subject matter experts
Step: 2 Unlock
Step: 3 Unlock