

Question: Use MATLAB to plot the function P = 5 e - 0 . 3 t 4 c o s ( 2 t ) over the
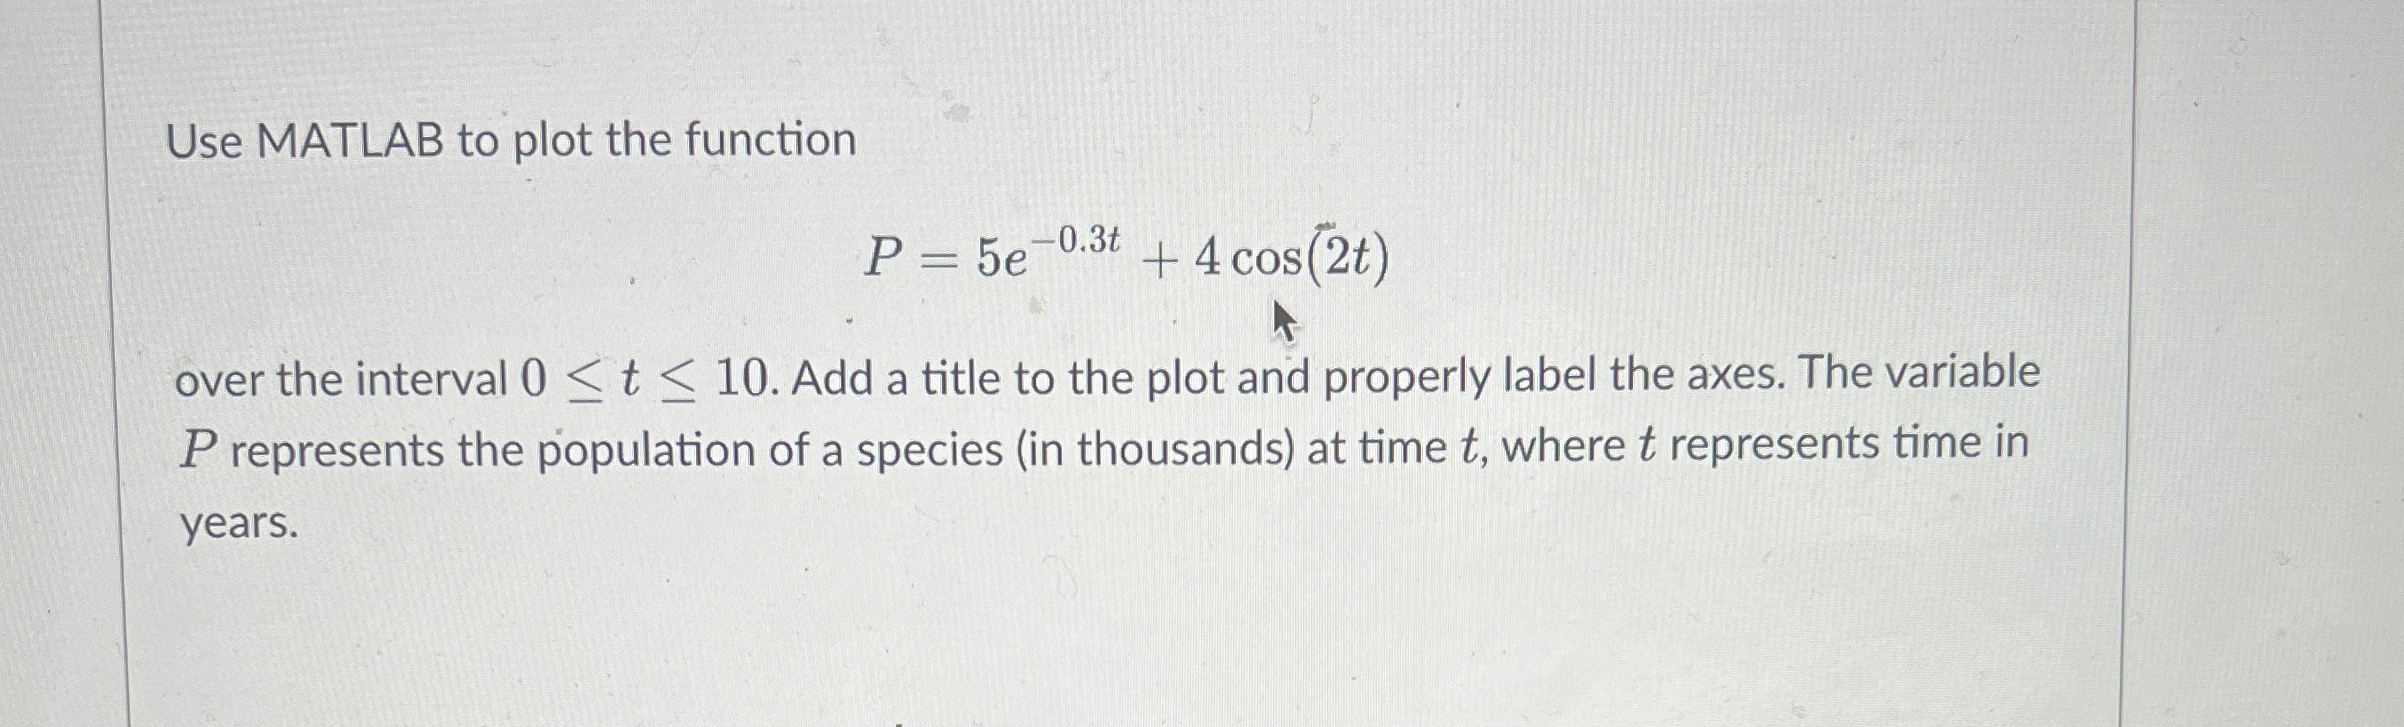
Use MATLAB to plot the function
over the interval Add a title to the plot and properly label the axes. The variable represents the population of a species in thousands at time where represents time in years.
Step by Step Solution
There are 3 Steps involved in it
1 Expert Approved Answer
Step: 1 Unlock

Question Has Been Solved by an Expert!
Get step-by-step solutions from verified subject matter experts
Step: 2 Unlock
Step: 3 Unlock