

Question: Use Matlab to plot the PM and FM waves produced by the sawtooth wave shown in Figure P4.1 on page 140 of the textbook. The
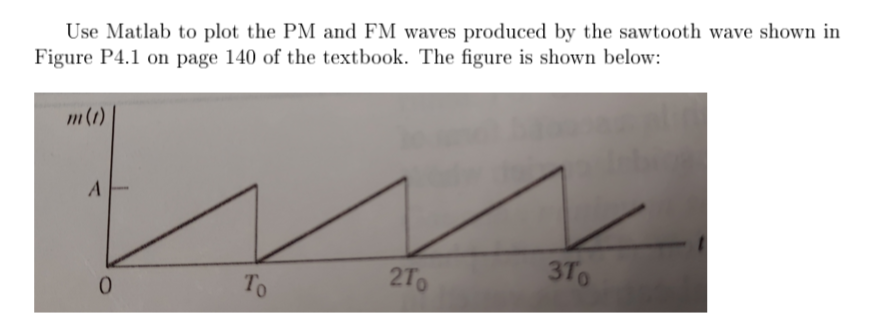
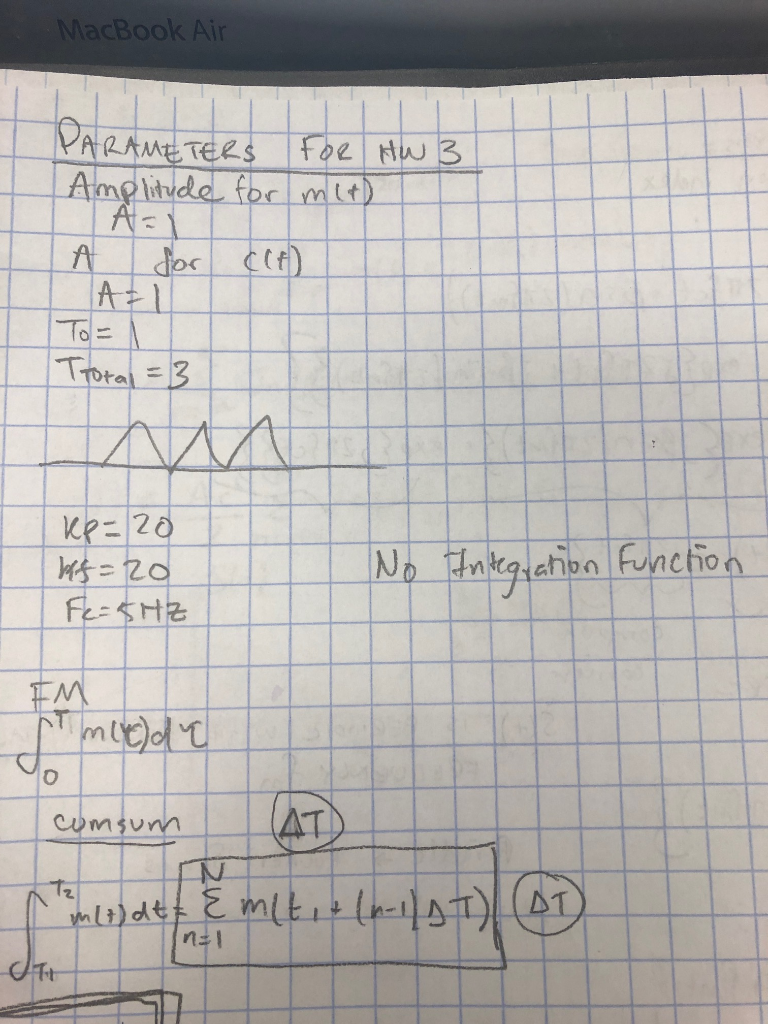
Use Matlab to plot the PM and FM waves produced by the sawtooth wave shown in Figure P4.1 on page 140 of the textbook. The figure is shown below: i (1 0 2To 3T 0 0 0 0 Nnhon funcio rt dk
Step by Step Solution
There are 3 Steps involved in it
1 Expert Approved Answer
Step: 1 Unlock

Question Has Been Solved by an Expert!
Get step-by-step solutions from verified subject matter experts
Step: 2 Unlock
Step: 3 Unlock