

Question: Use Matlab to solve. Generate spike trains using both a Bernoulli process, and an exponential spike interval distribution (ISI). Compare spike counts for both to
 Use Matlab to solve.
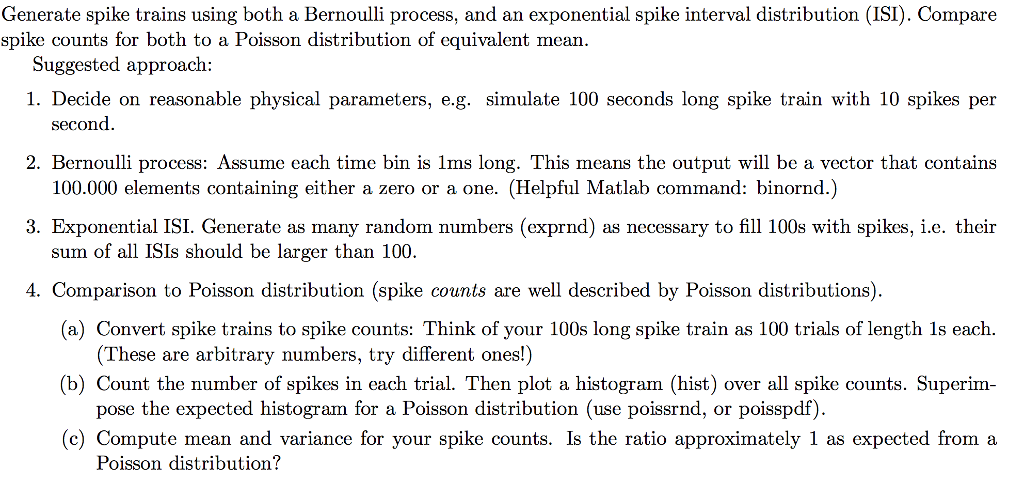
Generate spike trains using both a Bernoulli process, and an exponential spike interval distribution (ISI). Compare spike counts for both to a Poisson distribution of equivalent mean. Suggested approach: 1. Decide on reasonable physical parameters, e.g. simulate 100 seconds long spike train with 10 spikes per second. 2. Bernoulli process: Assume each time bin is 1ms long. This means the output wil be a vector that contains 3. Exponential ISI. Generate as many random numbers (exprnd) as necessary to fill 100s with spikes, i.e. their 4. Comparison to Poisson distribution (spike counts are well described by Poisson distributions) 100.000 elements containing either a zero or a one. (Helpful Matlab command: binornd.) sum of all ISIs should be larger than 100. (a) Convert spike trains to spike counts: Think of your 100s long spike train as 100 trials of length Is each. (b) Count the number of spikes in each trial. Then plot a histogram (hist) over all spike counts. Superim (c) Compute mean and variance for your spike counts. Is the ratio approximately 1 as expected from a (These are arbitrary numbers, try different ones!) pose the expected histogram for a Poisson distribution (use poissrnd, or poisspdf). Poisson distribution? Generate spike trains using both a Bernoulli process, and an exponential spike interval distribution (ISI). Compare spike counts for both to a Poisson distribution of equivalent mean. Suggested approach: 1. Decide on reasonable physical parameters, e.g. simulate 100 seconds long spike train with 10 spikes per second. 2. Bernoulli process: Assume each time bin is 1ms long. This means the output wil be a vector that contains 3. Exponential ISI. Generate as many random numbers (exprnd) as necessary to fill 100s with spikes, i.e. their 4. Comparison to Poisson distribution (spike counts are well described by Poisson distributions) 100.000 elements containing either a zero or a one. (Helpful Matlab command: binornd.) sum of all ISIs should be larger than 100. (a) Convert spike trains to spike counts: Think of your 100s long spike train as 100 trials of length Is each. (b) Count the number of spikes in each trial. Then plot a histogram (hist) over all spike counts. Superim (c) Compute mean and variance for your spike counts. Is the ratio approximately 1 as expected from a (These are arbitrary numbers, try different ones!) pose the expected histogram for a Poisson distribution (use poissrnd, or poisspdf). Poisson distribution
Step by Step Solution
There are 3 Steps involved in it

Get step-by-step solutions from verified subject matter experts