

Question: use MATLAB to solve, write a script and plot the graph. (3 points) Below you will find three different sets of data (a, b, and
use MATLAB to solve, write a script and plot the graph.
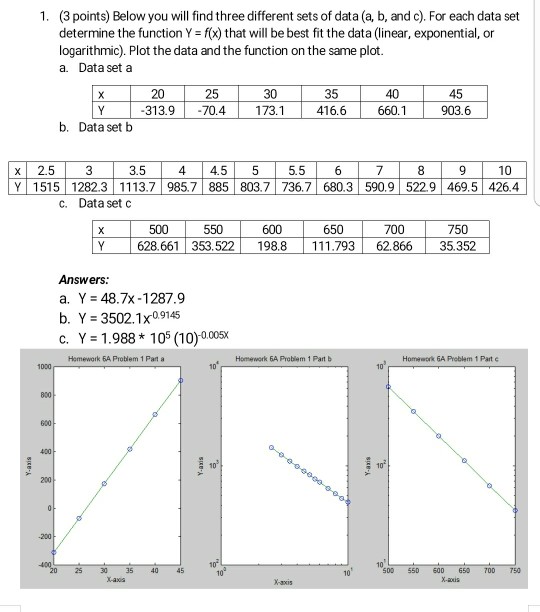
(3 points) Below you will find three different sets of data (a, b, and c). For each data set determine the function Y = f(x) that will be best fit the data (linear, exponential, or logarithmic). Plot the data and the function on the same plot a. Data set a 1. 25 313.970.4173.1 35 416.6 45 903.6 30 40 660.1 20 b. Data set b x 2.53 Y 1515 1282.3 1113.7 985.7 885 803.7 736.7 680.3 590.9 522.9 469.5 426.4 3.5 4 4.5 5 5.5 6 7 c. Data set c 550 750 500 628.661 353.522 198.8 111.79362.866 35.352 600 650 700 Answers: a. Y 48.7x-1287.9 b. Y 3502.1x09145 c. Y= 1.988 * 109(10)0.005x Homework 6A Probem 1 Part a Homework 6A Prablem 1 Part b Homework 6A Problem 1 Part c 25 30 40 45 00 55D 600 650 70 750
Step by Step Solution
There are 3 Steps involved in it

Get step-by-step solutions from verified subject matter experts