

Question: Use Maxima, a Computer Algebra System in order to complete the task. Here is the reference if you don't have Maxima and that you need
Use Maxima, a Computer Algebra System in order to complete the task. Here is the reference if you don't have Maxima and that you need to install it : https://wxmaxima-developers.github.io/wxmaxima/download.html
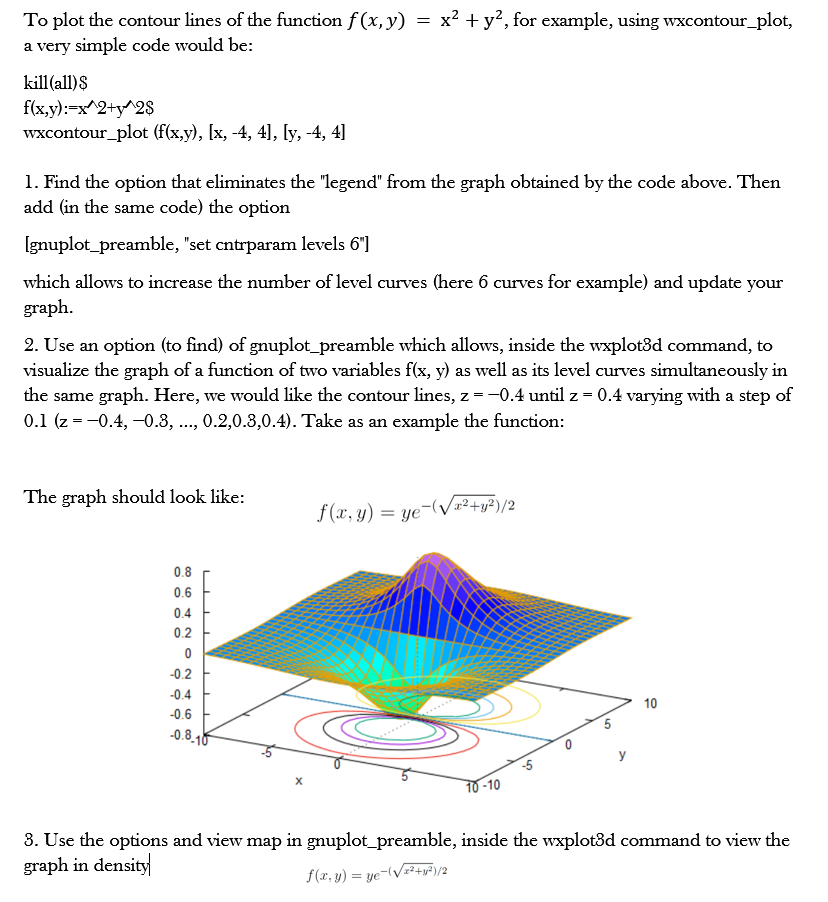
To plot the contour lines of the function f (x, y) = x2 + y, for example, using wxcontour_plot, a very simple code would be: kill(all) $ f(x,y):=x 2+y 2$ wxcontour_plot (f(x,y), [x, -4, 4], [y, -4, 4] 1. Find the option that eliminates the "legend" from the graph obtained by the code above. Then add (in the same code) the option [gnuplot_preamble, "set cntrparam levels 6"] which allows to increase the number of level curves (here 6 curves for example) and update your graph. 2. Use an option (to find) of gnuplot_preamble which allows, inside the wxplot3d command, to visualize the graph of a function of two variables f(x, y) as well as its level curves simultaneously in the same graph. Here, we would like the contour lines, z - -0.4 until z = 0.4 varying with a step of 0.1 (z = -0.4, -0.3, ..., 0.2,0.3,0.4). Take as an example the function: The graph should look like: f(x, y) = ye (Vaz+y2)/2 0.8 0.6 0.4 0.2 0.2 0.4 10 5 -0.8-10 0 -5 10 -10 8. Use the options and view map in gnuplot_preamble, inside the wxplot3d command to view the graph in density f(x, y) = ye-(V12+w-)/2
Step by Step Solution
There are 3 Steps involved in it

Get step-by-step solutions from verified subject matter experts