Question: USE MINITAB..... show step by step solution using minitab. answer all the questions. A factorial experiment is designed to improve a silver powder production process.

USE MINITAB..... show step by step solution using minitab. answer all the questions. USE MINITAB..... show step by step solution using
USE MINITAB..... show step by step solution using
A factorial experiment is designed to improve a silver powder production process. This product is used in conductive pastes to manufacture a wide variety of products ranging from silicon wafers to elastic membrane switches. Power density (g/cm) and surface area (cm /g) are the two critical characteristics of this product. The experiments involved three factors: reaction temperature, ammonium percentage, and stirring rate. Each of these factors had two levels, and the design was replicated twice. The design is shown as follows; the outputs are shown in average values (two replications): Stir Rate Temperature Surface Ammonium ($) RPM Density Area 2 8 8 8 8 30 30 2 2 30 30 100 100 100 100 150 150 150 150 100 8 15.18 15.12 17.18 7.54 6.66 12.46 12.62 10.95 17.68 12.65 15.96 8.03 8 30 0.40 0.43 042 0.41 0.69 067 0.52 036 05 041 0:57 054 06 0.75 0.41 0.41 100 30 2 30 30 2 100 150 40 150 14.96 14.96 150 20 Please analyze this design. Suppose that the specifications require that the surface area must be between 0.3 and 0.6 cm/g and that the density must be less than 14 g/cm? Find a set of operating conditions that will result in a product that meets these requirements by the tools in Minitab of Overlaid contour plots and response optimizer. List and explain the philosophy and basic concepts of quality improvement in industrial and manufacture field. List and explain the philosophy and basic concepts of statistical methods useful in Statistical Process Control. Process Design and Improvement with Designed Experiment (no data available for Acceptance Sampling in this instruction) Apply technology to the design and interpretation of Quality Control Problems, including: Parameters estimating for difference distributions. Histogram, box-plotting, Normal Probability Plotting, Statistical inferences. Statistical Process control techniques: X-bar and R charts, X-bar and S charts, Moving chart, and P chart, average run length, etc. Design experiment techniques: Main effects and interactions of factors, factorial design, ANOVA, Residual Analysis, Contour plots and response surface plots, etc

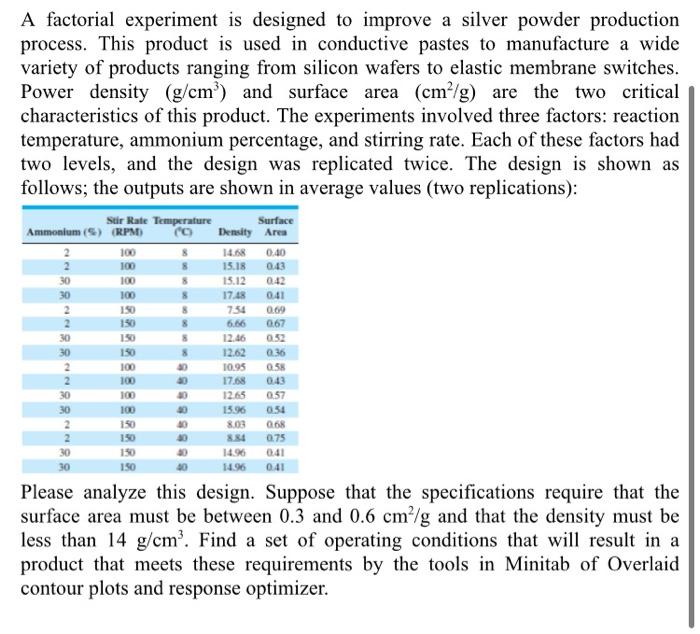
Step by Step Solution

There are 3 Steps involved in it

1 Expert Approved Answer
Step: 1 Unlock blur-text-image
Question Has Been Solved by an Expert!

Get step-by-step solutions from verified subject matter experts

Step: 2 Unlock
Step: 3 Unlock

Students Have Also Explored These Related General Management Questions!