

Question: Use only Numpy and Matplotlib All other packages are NOT allowed Using Python, Plot the contour figure of Z. (Plot the value of Z using
Use only Numpy and Matplotlib
All other packages are NOT allowed
Using Python,

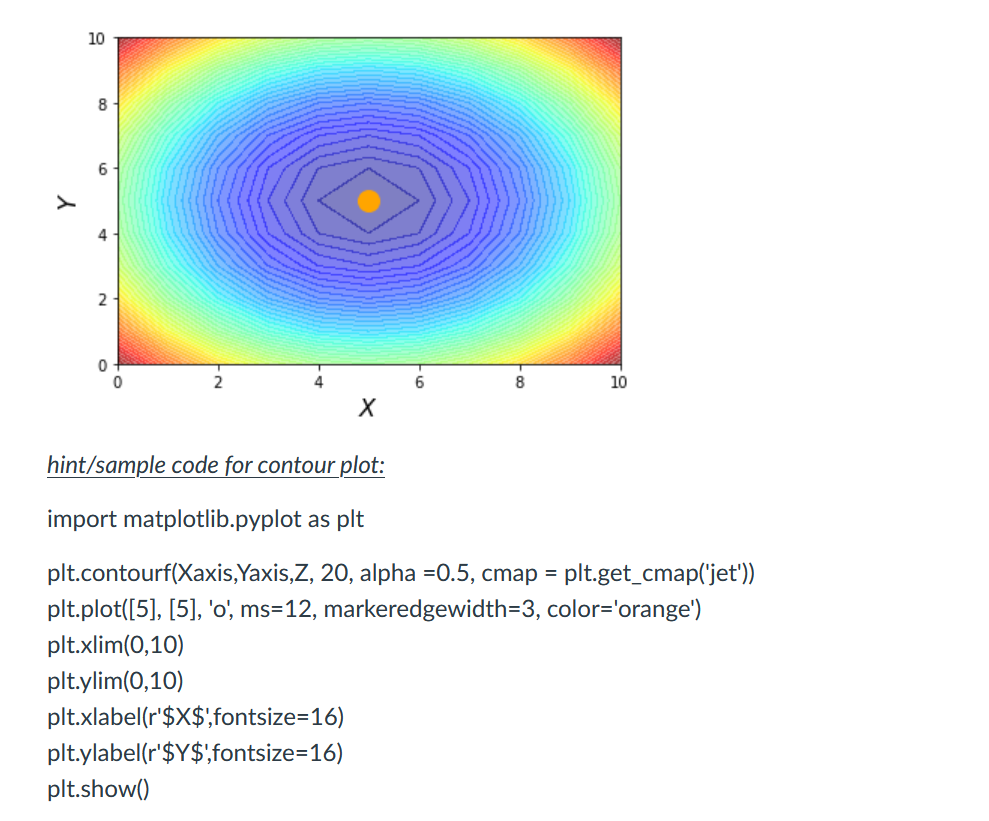
Plot the contour figure of Z. (Plot the value of Z using different colors at each possible (X,Y) location.) Your figure should look similar to this. Mark the X and Y axis and mark out the Z's minimum value on the figure. 10 8 6 4 2 4 6 8 10 hint/sample code for contour plot: import matplotlib.pyplot as plt plt.contourf(Xaxis, Yaxis,Z, 20, alpha=0.5, cmap = plt.get_cmap('jet')) plt.plot([5], [5], 'o', ms=12, markeredgewidth=3, color='orange') plt.xlim(0,10) plt.ylim(0,10) plt.xlabel(r'$X$',fontsize=16) plt.ylabel(r'$y$',fontsize=16) plt.show()
Step by Step Solution
There are 3 Steps involved in it
1 Expert Approved Answer
Step: 1 Unlock

Question Has Been Solved by an Expert!
Get step-by-step solutions from verified subject matter experts
Step: 2 Unlock
Step: 3 Unlock