

Question: use percent % in A Task 3 - Maintenance & Simulation ABC Manufacturing Company has a 2500 KVA Generator Set which is mainly used as
use percent % in A
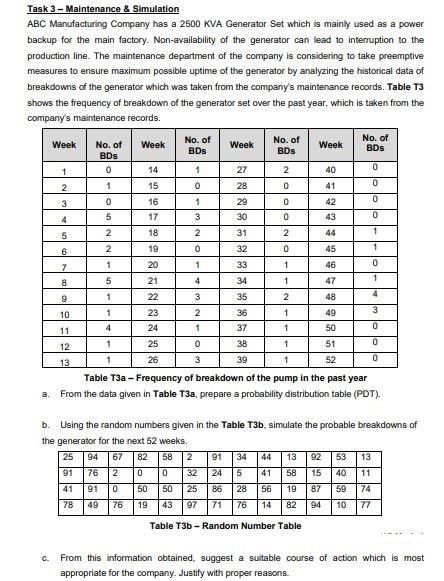
Task 3 - Maintenance & Simulation ABC Manufacturing Company has a 2500 KVA Generator Set which is mainly used as a power backup for the main factory. Non-availability of the generator can lead to interruption to the production line. The maintenance department of the company is considering to take preemptive measures to ensure maximum possible uptime of the generator by analyzing the historical data of breakdowns of the generator which was taken from the company's maintenance records. Table T3 shows the frequency of breakdown of the generator set over the past year, which is taken from the company's maintenance records, Week Week No. of BDs Week No. of BDs Week No. of BDS No. of BDs 0 1 14 1 0 40 2 0 2 1 0 0 3 0 0 5 0 27 28 29 30 31 15 16 17 18 1 3 41 42 43 4 0 0 5 2 2 2 1 6 2 19 0 32 0 45 1 1 20 1 7 33 1 46 0 1 8 5 4 34 1 47 9 1 4 3 35 2 48 21 22 23 24 1 2 36 1 49 3 10 11 12 4 1 1 0 37 38 50 51 1 0 1 0 25 26 13 1 3 39 1 52 0 Table T3a - Frequency of breakdown of the pump in the past year From the data given in Table T3a, prepare a probability distribution table (PDT). a. b. Using the random numbers given in the Table T3b, simulate the probable breakdowns of the generator for the next 52 weeks. 25 94 67 82 58 2 91 34 44 13 92 53 13 91 76 2 0 0 32 24 5 41 58 15 40 11 41 91 0 50 25 86 28 56 19 87 59 74 78 49 76 19 43 97 71 76 14 82 94 10 77 Table T3b - Random Number Table c. From this information obtained, suggest a suitable course of action which is most appropriate for the company. Justify with proper reasons. Task 3 - Maintenance & Simulation ABC Manufacturing Company has a 2500 KVA Generator Set which is mainly used as a power backup for the main factory. Non-availability of the generator can lead to interruption to the production line. The maintenance department of the company is considering to take preemptive measures to ensure maximum possible uptime of the generator by analyzing the historical data of breakdowns of the generator which was taken from the company's maintenance records. Table T3 shows the frequency of breakdown of the generator set over the past year, which is taken from the company's maintenance records, Week Week No. of BDs Week No. of BDs Week No. of BDS No. of BDs 0 1 14 1 0 40 2 0 2 1 0 0 3 0 0 5 0 27 28 29 30 31 15 16 17 18 1 3 41 42 43 4 0 0 5 2 2 2 1 6 2 19 0 32 0 45 1 1 20 1 7 33 1 46 0 1 8 5 4 34 1 47 9 1 4 3 35 2 48 21 22 23 24 1 2 36 1 49 3 10 11 12 4 1 1 0 37 38 50 51 1 0 1 0 25 26 13 1 3 39 1 52 0 Table T3a - Frequency of breakdown of the pump in the past year From the data given in Table T3a, prepare a probability distribution table (PDT). a. b. Using the random numbers given in the Table T3b, simulate the probable breakdowns of the generator for the next 52 weeks. 25 94 67 82 58 2 91 34 44 13 92 53 13 91 76 2 0 0 32 24 5 41 58 15 40 11 41 91 0 50 25 86 28 56 19 87 59 74 78 49 76 19 43 97 71 76 14 82 94 10 77 Table T3b - Random Number Table c. From this information obtained, suggest a suitable course of action which is most appropriate for the company. Justify with proper reasons
Step by Step Solution
There are 3 Steps involved in it

Get step-by-step solutions from verified subject matter experts