Question: Use python coding to answer the tasks import numpy as npimport pandas as pd import matplotlib.pyplot as pltimport seaborn as snsdf = pd.read_csv(multiTimeline.csv, encoding='ISO-8859-1')df [9]:

Use python coding to answer the tasks

import numpy as npimport pandas as pd import matplotlib.pyplot as pltimport seaborn as snsdf = pd.read_csv("multiTimeline.csv", encoding='ISO-8859-1')df
Use python coding to answer the tasks importUse python coding to answer the tasks importUse python coding to answer the tasks importUse python coding to answer the tasks importUse python coding to answer the tasks import
[9]: Week 2015-12- 27 2016-01- 03 2016-01- 10 2016-01- iF 2016-01- 24 amazon: (Google Shopping) a4 v7 76 73 75 amazon: (News search) 18 tam: (News search) amazon: (Youtube search) 28 22 23 on a2 Open 33,28 32.81 30.62 28,85 High 34.82 32.89 31.30 30.00 31.90 Low 33.28 28.26 27.36 28.50 Close 33.79 30.35 28.51 29,82 29,35 Close 33.79 30.35 28.51 29.82 29.35 Volume 335,744,000 661,082,000 645,868,000 456,918,000 840,150,000 4.2 Missing Values 4.3 Outlier Detection 4.4 Feature Engineering (If it adds value, do it) 4.5 Feature Scaling5. Visualizations, Analytical Methods & Implementation 5.1 Exploratory Data Analysis 5.1.1 What were the search patterns on Google related to Amazon and taxes?? Two line graphs will be presented to illustrate the historical patterns: one showing Google search interest related to Amazon and taxes, and the other displaying Amazon's stock value over the same time period. Depending on visual clarity and coherence, these may be shown either as two separate plots or combined into a single figure5.2 Statistical Data Objectives and Questions 5.2.1 Is there a correlation between online interest and Amazon's commercial value? Heatmap of Correlations, Scatter Plot and, Dual-axis Time Series Plot (Do at least 2 of those plots)5.3 Machine Learning Objectives and Questions 5.3.1 Assess how search engine trends influence Amazon's commercial value explore whether dimensionality reduction and clustering can be applied to the dataset. Additionally, a linear regression model should be developed where the dependent variable (Y) is Amazon's commercial value and the independent variable (X) is the volume of online search queries related to Amazon One visualization should be produced for each method, one visualization for reduction, one for cluster and for the model should be a linear prediction plot showing the regression line and observed values

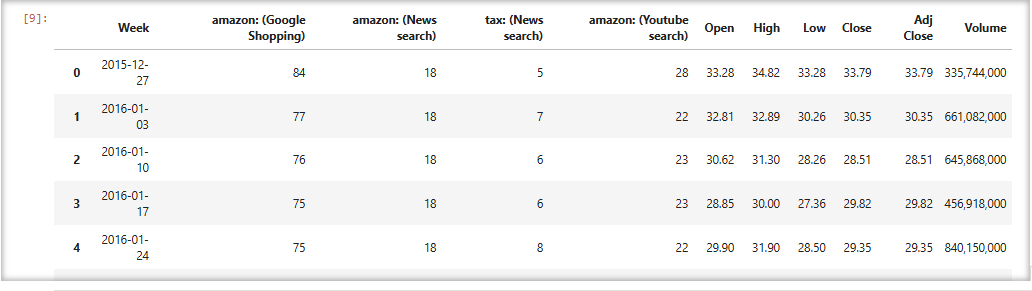
Step by Step Solution

There are 3 Steps involved in it

1 Expert Approved Answer
Step: 1 Unlock blur-text-image
Question Has Been Solved by an Expert!

Get step-by-step solutions from verified subject matter experts

Step: 2 Unlock
Step: 3 Unlock

Students Have Also Explored These Related Accounting Questions!