

Question: Use Python Create a function that takes a list as an argument. The function uses the turtle module to graph the values from the list.
Use Python 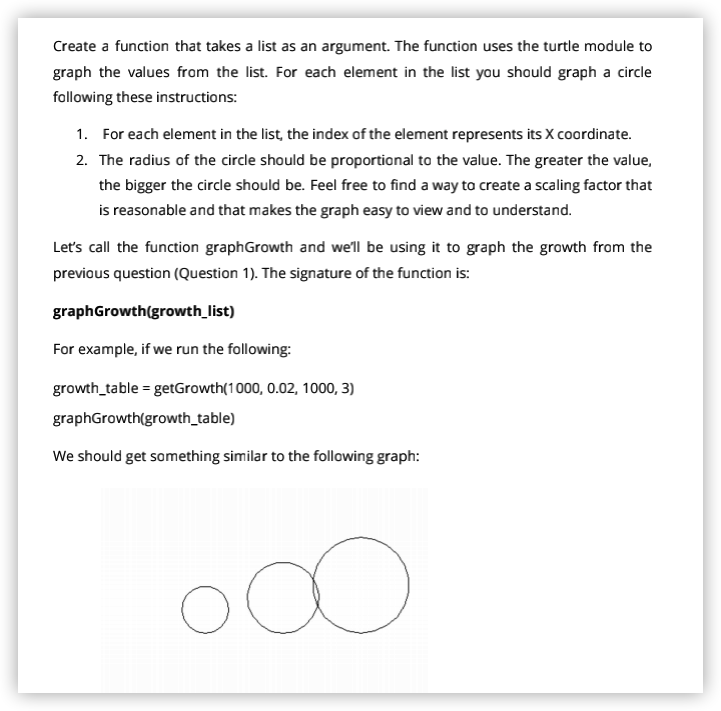
Create a function that takes a list as an argument. The function uses the turtle module to graph the values from the list. For each element in the list you should graph a circle following these instructions: 1. For each element in the list, the index of the element represents its X coordinate. 2. The radius of the circle should be proportional to the value. The greater the value, the bigger the circle should be. Feel free to find a way to create a scaling factor that is reasonable and that makes the graph easy to view and to understand. Let's call the function graphGrowth and we'll be using it to graph the growth from the previous question (Question 1). The signature of the function is: graphGrowth(growth_list) For example, if we run the following: growth_table = getGrowth(1000, 0.02, 1000, 3) graphGrowth(growth_table) We should get something similar to the following graph
Step by Step Solution
There are 3 Steps involved in it

Get step-by-step solutions from verified subject matter experts