

Question: Use quadratic regression to find a function that models the data. Plot the data and the quadratic regression curve. The table to the right
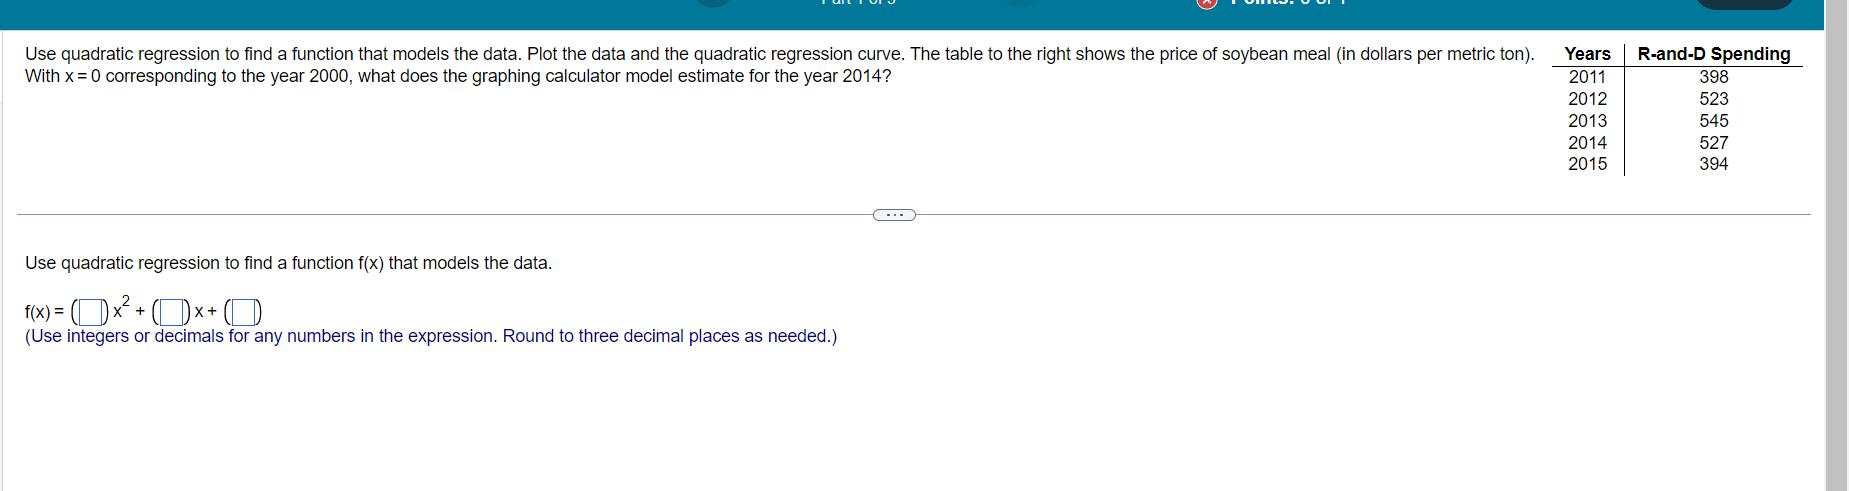
Use quadratic regression to find a function that models the data. Plot the data and the quadratic regression curve. The table to the right shows the price of soybean meal (in dollars per metric ton). With x = 0 corresponding to the year 2000, what does the graphing calculator model estimate for the year 2014? Use quadratic regression to find a function f(x) that models the data. f(x) = x + x + O (Use integers or decimals for any numbers in the expression. Round to three decimal places as needed.) Years 2011 2012 2013 2014 2015 R-and-D Spending 398 523 545 527 394
Step by Step Solution
3.53 Rating (156 Votes )
There are 3 Steps involved in it
Total X 11 12 13 14 15 65 Let required equation is Letyabxcx... View full answer

Get step-by-step solutions from verified subject matter experts