

Question
Use quarterly, end-of-period Federal Reserve Economic Data (FRED) between January 2007 and December 2020 to produce one graph (Figure 1) showing growth rates in real
Use quarterly, end-of-period Federal Reserve Economic Data (FRED) between January 2007 and December 2020 to produce one graph (Figure 1) showing growth rates in real GDP and the cyclical rate of unemployment in the U.S. economy. Measure the unemployment rate on the secondary axis. Copy your Excel-generated graph into your answer file and proceed with part (b) below.
Adjacent to the graph you produced in (a) above. Explain how long it took cyclical unemployment to fall back to pre-recession rates. Also, with assistance from ChatGPT, discuss in no more than 100 words two causes for the recovery of labor markets in the US to have extended beyond 2009.
Now, generate a graph (Figure 2) of the natural unemployment rates during January 2007 and December 2020 directly from FRED and copy it underneath your answer to (b) above. Underneath and in no more than 100 words, assisted by ChatGPT, what explains the observed trend in the natural rate of unemployment during that period?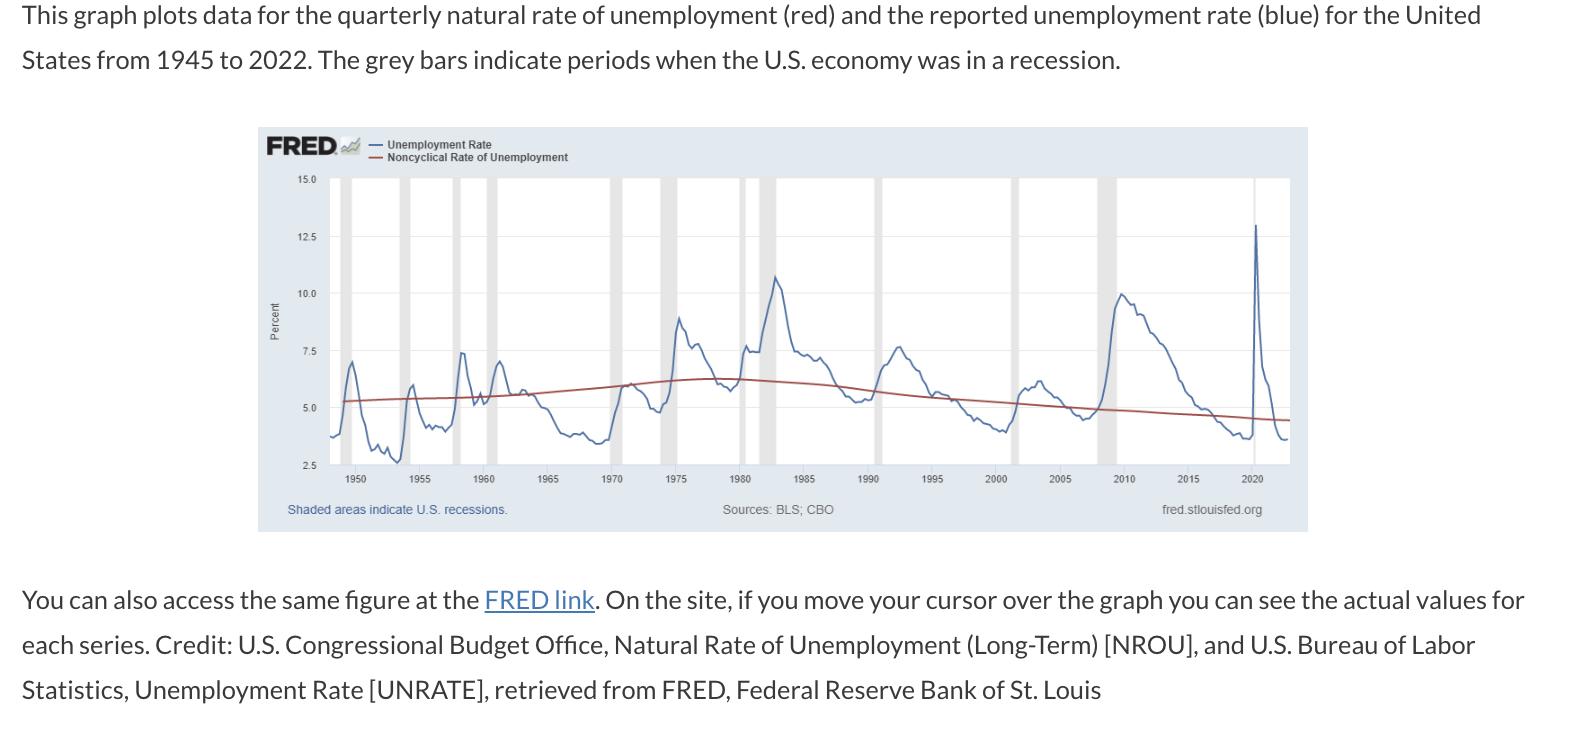
This graph plots data for the quarterly natural rate of unemployment (red) and the reported unemployment rate (blue) for the United States from 1945 to 2022. The grey bars indicate periods when the U.S. economy was in a recession. Percent FRED or Unemployment Rate Noncyclical Rate of Unemployment 15.0 12.5 10.0 7.5 50 5.0 M 2.5 1950 1955 1960 1965 1970 1975 1980 1985 1990 1995 2000 2005 2010 2015 2020 Shaded areas indicate U.S. recessions. Sources: BLS; CBO fred.stlouisfed.org You can also access the same figure at the FRED link. On the site, if you move your cursor over the graph you can see the actual values for each series. Credit: U.S. Congressional Budget Office, Natural Rate of Unemployment (Long-Term) [NROU], and U.S. Bureau of Labor Statistics, Unemployment Rate [UNRATE], retrieved from FRED, Federal Reserve Bank of St. Louis
Step by Step Solution
There are 3 Steps involved in it
Step: 1
a Creating Figure 1 Use FRED data to obtain quarterly real GDP growth rates and the cyclical unemplo...
Get Instant Access to Expert-Tailored Solutions
See step-by-step solutions with expert insights and AI powered tools for academic success
Step: 2

Step: 3
Ace Your Homework with AI
Get the answers you need in no time with our AI-driven, step-by-step assistance
Get Started
International Finance Theory and Policy
Authors: Paul R. Krugman, Maurice Obstfeld, Marc J. Melitz
10th edition
978-0133425895, 133425894, 978-0133423631, 133423638, 978-0133423648