

Question: use questions 1 & 2 to answer question 3 Please answer #3 and show all work 1). (answer is given) Tabulate and draw the investment
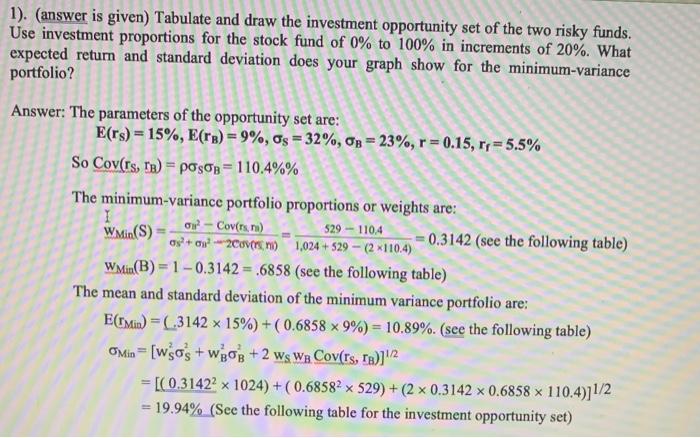
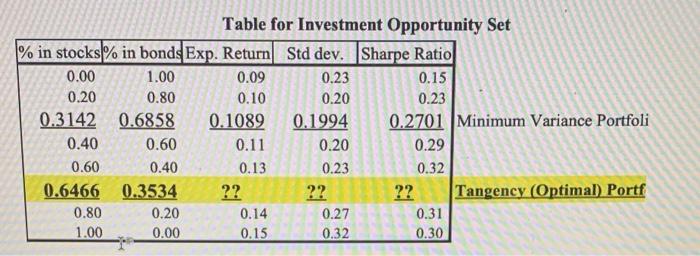
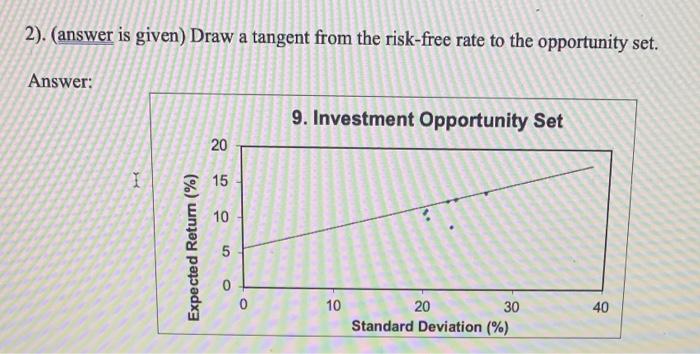
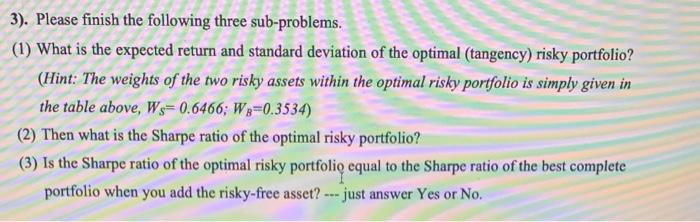
1). (answer is given) Tabulate and draw the investment opportunity set of the two risky funds. Use investment proportions for the stock fund of 0% to 100% in increments of 20%. What expected return and standard deviation does your graph show for the minimum-variance portfolio? 529 - 110.4 Answer: The parameters of the opportunity set are: E(rs) = 15%, E(re) = 9%, Os = 32%, Op = 23%, r=0.15, r;= 5.5% So Cov(rs, Tp) = posos = 110.4%% The minimum-variance portfolio proportions or weights are: 1 Or - Covers, no) WMin(S) 0.3142 (see the following table) aslow2COVSTVO 1,024 +529 - -- (2 x 110.4) Win(B) = 1 -0.3142 = .6858 (see the following table) The mean and standard deviation of the minimum variance portfolio are: E(Tin) =(,3142 x 15%) + (0.6858 x 9%) = 10.89%. (see the following table) O Min = [wsos + WBOB+2 ws Wp Cov(rs, ra)]\/2 = [(0.31422 x 1024) + (0.68582 x 529) + (2 x 0.3142 0.6858 x 110.4)]1/2 19.94% (See the following table for the investment opportunity set) Table for Investment Opportunity Set % in stocks in bonds Exp. Return Std dev. Sharpe Ratio 0.00 1.00 0.09 0.23 0.15 0.20 0.80 0.10 0.20 0.23 0.3142 0.6858 0.1089 0.1994 0.2701 Minimum Variance Portfoli 0.40 0.60 0.11 0.20 0.29 0.60 0.40 0.13 0.23 0.32 0.6466 0.3534 ?? ?? ?? Tangency (Optimal) Portf 0.80 0.20 0.14 0.27 0.31 1.00 0.00 0.15 0.32 0.30 2). (answer is given) Draw a tangent from the risk-free rate to the opportunity set. Answer: 9. Investment Opportunity Set 20 I 15 10 Expected Return (%) 5 0 0 10 40 20 30 Standard Deviation (%) 3). Please finish the following three sub-problems. (1) What is the expected return and standard deviation of the optimal (tangency) risky portfolio? (Hint: The weights of the two risky assets within the optimal risky portfolio is simply given in the table above, W=0.6466; W:=0.3534) (2) Then what is the Sharpe ratio of the optimal risky portfolio? (3) Is the Sharpe ratio of the optimal risky portfolio equal to the Sharpe ratio of the best complete portfolio when you add the risky-free asset? --- just answer Yes or No
Step by Step Solution
There are 3 Steps involved in it

Get step-by-step solutions from verified subject matter experts