

Question: Use R code answe just f , h , i , j Let's work on the mpg dataset in the package ggplot 2 . Use
Use R code answe just f h i j Let's work on the mpg dataset in the package ggplot Use necessary code to read the description of the dataset, which contains samples and variables.
a Tum the variable cyl to an ordered factor variable with levels and
b Turn the variable trans to a factor variable, of which unique values are "auto" and "manu" Hint: use the function substr to extract substrings in a character vector before converting to a factor vector
c Tum the variable drv to an ordered factor variable with levels and
d Tum the variable to a factor variable, of which unique values are "gasoline", "diesel", and "other" Hint "other" should include and in the original variable: for E which is an ethanol fuel blend of ethanol fuel and gasoline and for compressed natural gas
e Tum the variable class to an ordered factor variable with levels seater", "subcompact", "compact", "midsize", "suv", "minivan", and "pickup"
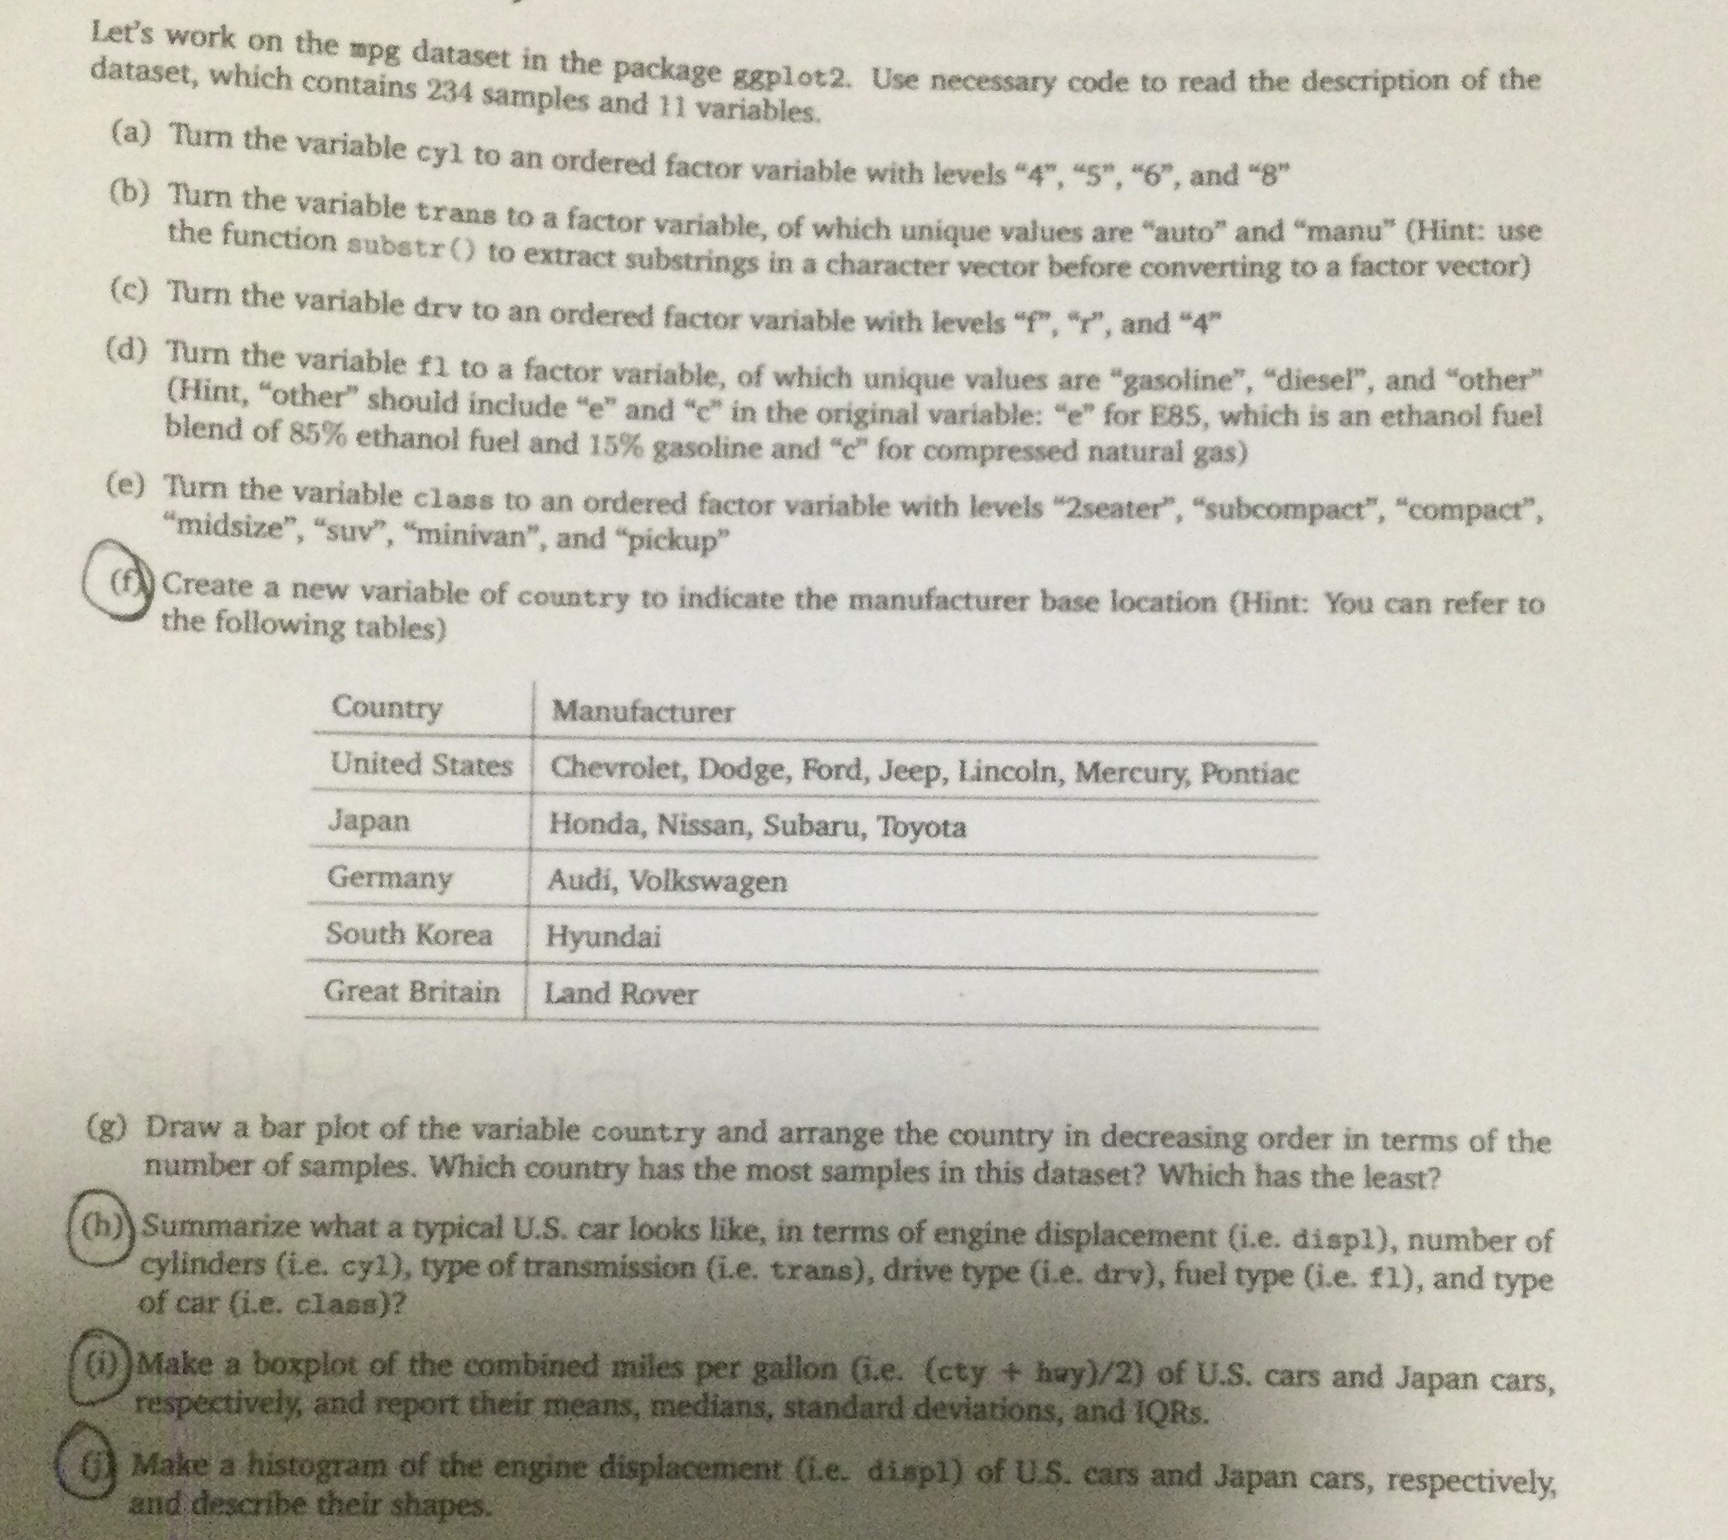
f Create a new variable of country to indicate the manufacturer base location Hint: You can refer to the following tables
tableCountryManufacturerUnited States,Chevrolet, Dodge, Ford, Jeep, Lincoln, Mercury, PontiacJapanHonda, Nissan, Subaru, ToyotaGermanyAudi, VolkswagenSouth Korea,HyundaiGreat Britain,Land Rover
g Draw a bar plot of the variable country and arrange the country in decreasing order in terms of the number of samples. Which country has the most samples in this dataset? Which has the least?
h Summarize what a typical US car looks like, in terms of engine displacement ie disp number of cylinders ie cy type of transmission ie trans drive type ie drv fuel type ie fl and type of car ie class
i Make a boxplot of the combined miles per gatlon iecty hry of US cars and Japan cars, respectively, and report their means, medians, standard deviations, and IQRs.
i Make a histogram of the engine displacement Le dispI of US cars and Japan cars, respectively, and describe their shapes.
Step by Step Solution
There are 3 Steps involved in it
1 Expert Approved Answer
Step: 1 Unlock

Question Has Been Solved by an Expert!
Get step-by-step solutions from verified subject matter experts
Step: 2 Unlock
Step: 3 Unlock