

Question: Use R Instructions As a new Data Scientist in the fuel production company you were assigned a task to prepare a slide demonstrating highway gas
Use R
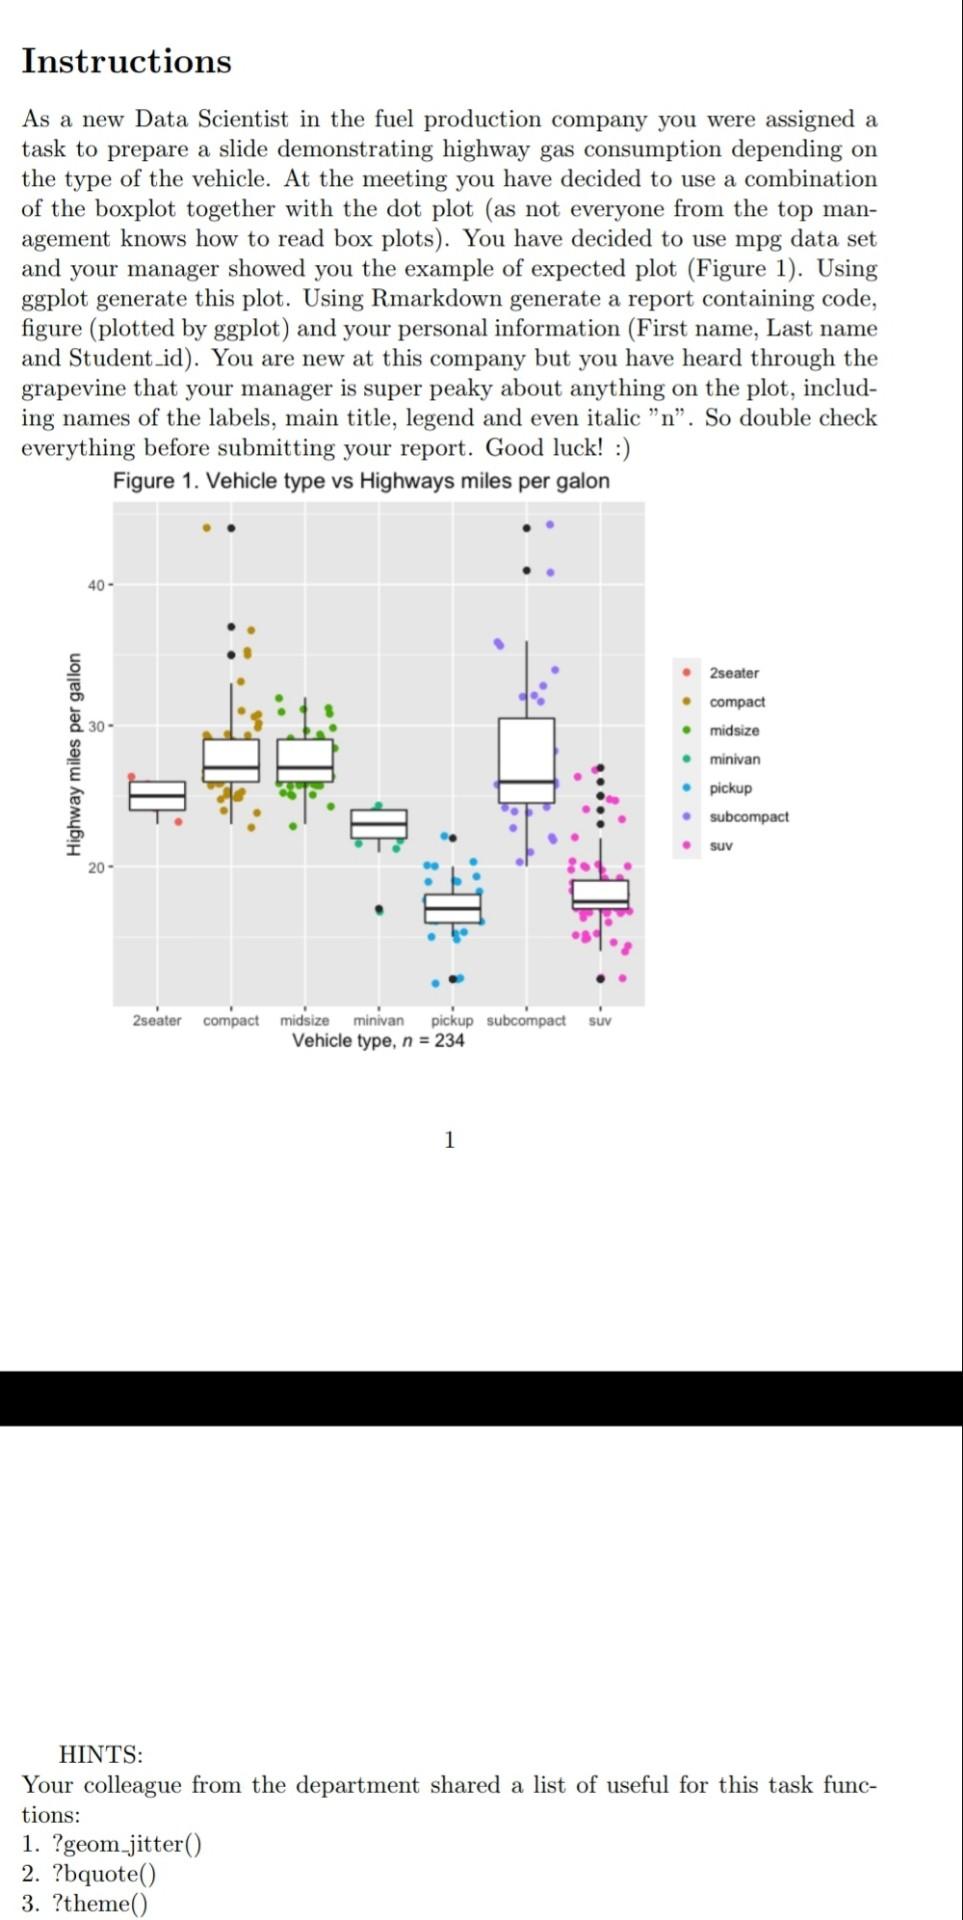
Instructions As a new Data Scientist in the fuel production company you were assigned a task to prepare a slide demonstrating highway gas consumption depending on the type of the vehicle. At the meeting you have decided to use a combination of the boxplot together with the dot plot (as not everyone from the top man- agement knows how to read box plots). You have decided to use mpg data set and your manager showed you the example of expected plot (Figure 1). Using ggplot generate this plot. Using Rmarkdown generate a report containing code, figure (plotted by ggplot) and your personal information (First name, Last name and Student_id). You are new at this company but you have heard through the grapevine that your manager is super peaky about anything on the plot, includ- ing names of the labels, main title, legend and even italic "n". So double check everything before submitting your report. Good luck! :) Figure 1. Vehicle type vs Highways miles per galon 40- 2 seater Highway miles per gallon compact midsize minivan pickup subcompact Suv T 20- TE Il 2seater suv compact midsize minivan pickup subcompact Vehicle type, n = 234 1 HINTS: Your colleague from the department shared a list of useful for this task func- tions: 1. ?geom_jitter() 2. ?bquote() 3. ?theme()
Step by Step Solution
There are 3 Steps involved in it

Get step-by-step solutions from verified subject matter experts