

Question: USE R! noting else and object from part 1 is just storing the chutes, ladders, and the dimensions of the board. In the script file,
USE R! noting else
and object from part 1 is just storing the chutes, ladders, and the dimensions of the board.
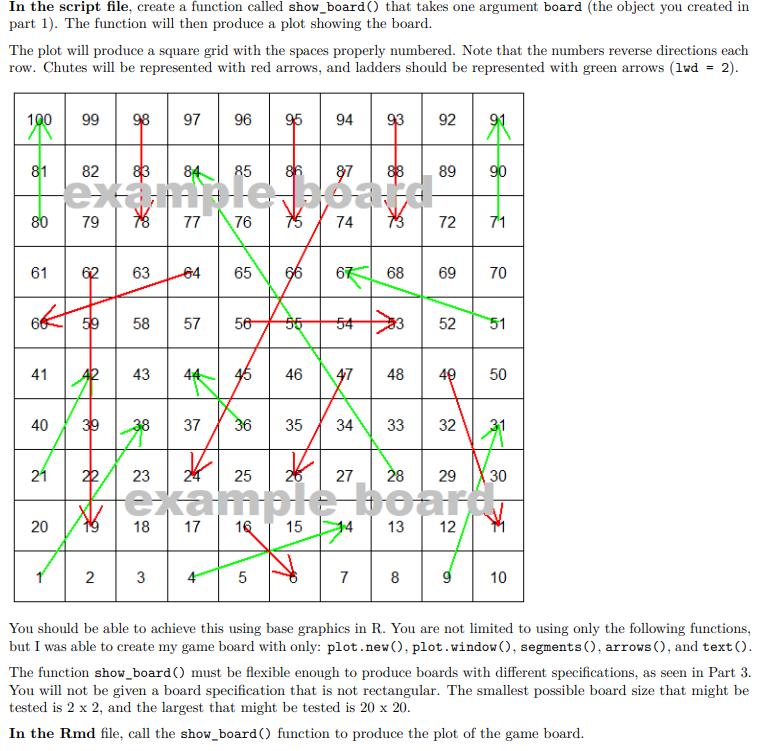
In the script file, create a function called show_board() that takes one argument board (the object you created in part 1). The function will then produce a plot showing the board. The plot will produce a square grid with the spaces properly numbered. Note that the numbers reverse directions each row. Chutes will be represented with red arrows, and ladders should be represented with green arrows (lwd = 2). 99 98 97 96 | 95 94 | 93 | 92 87 88 89 80 79 78 77 76 7574 | 73 72 71 66 59 58 57 56 55 543 7 28 ta 14 13 10 You should be able to achieve this using base graphics in R. You are not limited to using only the following functions, but I was able to create my game board with only: plot.new(), plot.window(), segments(), arrows(), and text(). The function show_board() must be flexible enough to produce boards with different specifications, as seen in Part 3. You will not be given a board specification that is not rectangular. The smallest possible board size that might be tested is 2 x 2, and the largest that might be tested is 20 x 20. In the Rmd file, call the show_board() function to produce the plot of the game board. In the script file, create a function called show_board() that takes one argument board (the object you created in part 1). The function will then produce a plot showing the board. The plot will produce a square grid with the spaces properly numbered. Note that the numbers reverse directions each row. Chutes will be represented with red arrows, and ladders should be represented with green arrows (lwd = 2). 99 98 97 96 | 95 94 | 93 | 92 87 88 89 80 79 78 77 76 7574 | 73 72 71 66 59 58 57 56 55 543 7 28 ta 14 13 10 You should be able to achieve this using base graphics in R. You are not limited to using only the following functions, but I was able to create my game board with only: plot.new(), plot.window(), segments(), arrows(), and text(). The function show_board() must be flexible enough to produce boards with different specifications, as seen in Part 3. You will not be given a board specification that is not rectangular. The smallest possible board size that might be tested is 2 x 2, and the largest that might be tested is 20 x 20. In the Rmd file, call the show_board() function to produce the plot of the game board
Step by Step Solution
There are 3 Steps involved in it

Get step-by-step solutions from verified subject matter experts