

Question: Use R software this question from bayesian methods by jeff gill chapter one 1.12 Buck, Cavanaugh, and Litton (1996) demonstrate the use of Bayesian statistics
Use R software
this question from bayesian methods by jeff gill chapter one 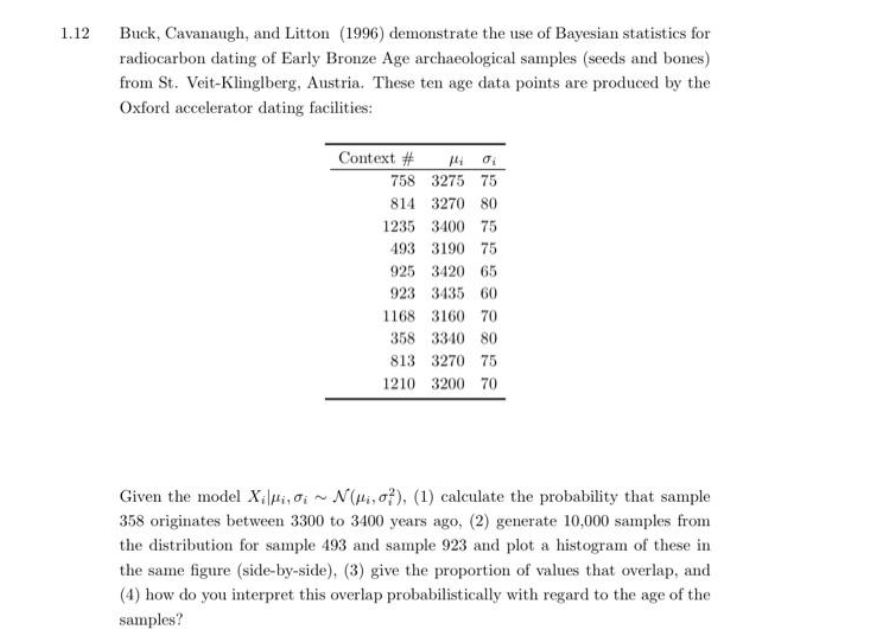
1.12 Buck, Cavanaugh, and Litton (1996) demonstrate the use of Bayesian statistics for radiocarbon dating of Early Bronze Age archaeological samples (seeds and bones) from St. Veit-Klinglberg, Austria. These ten age data points are produced by the Oxford accelerator dating facilities: Context # 758 3275 75 814 3270 80 1235 3400 75 493 3190 75 925 3420 65 923 3435 60 1168 3160 70 358 3310 80 813 3270 75 1210 3200 70 Given the model X Mi, 0; N(Mi, 0), (1) calculate the probability that sample 358 originates between 3300 to 3400 years ago, (2) generate 10,000 samples from the distribution for sample 493 and sample 923 and plot a histogram of these in the same figure (side-by-side), (3) give the proportion of values that overlap, and (4) how do you interpret this overlap probabilistically with regard to the age of the samples
Step by Step Solution
There are 3 Steps involved in it

Get step-by-step solutions from verified subject matter experts