Question: use R to solve the question, write the code. Consider the regression predicting Sunday circulation from daily circulation. Plot of data and output of 1m()
use R to solve the question, write the code.
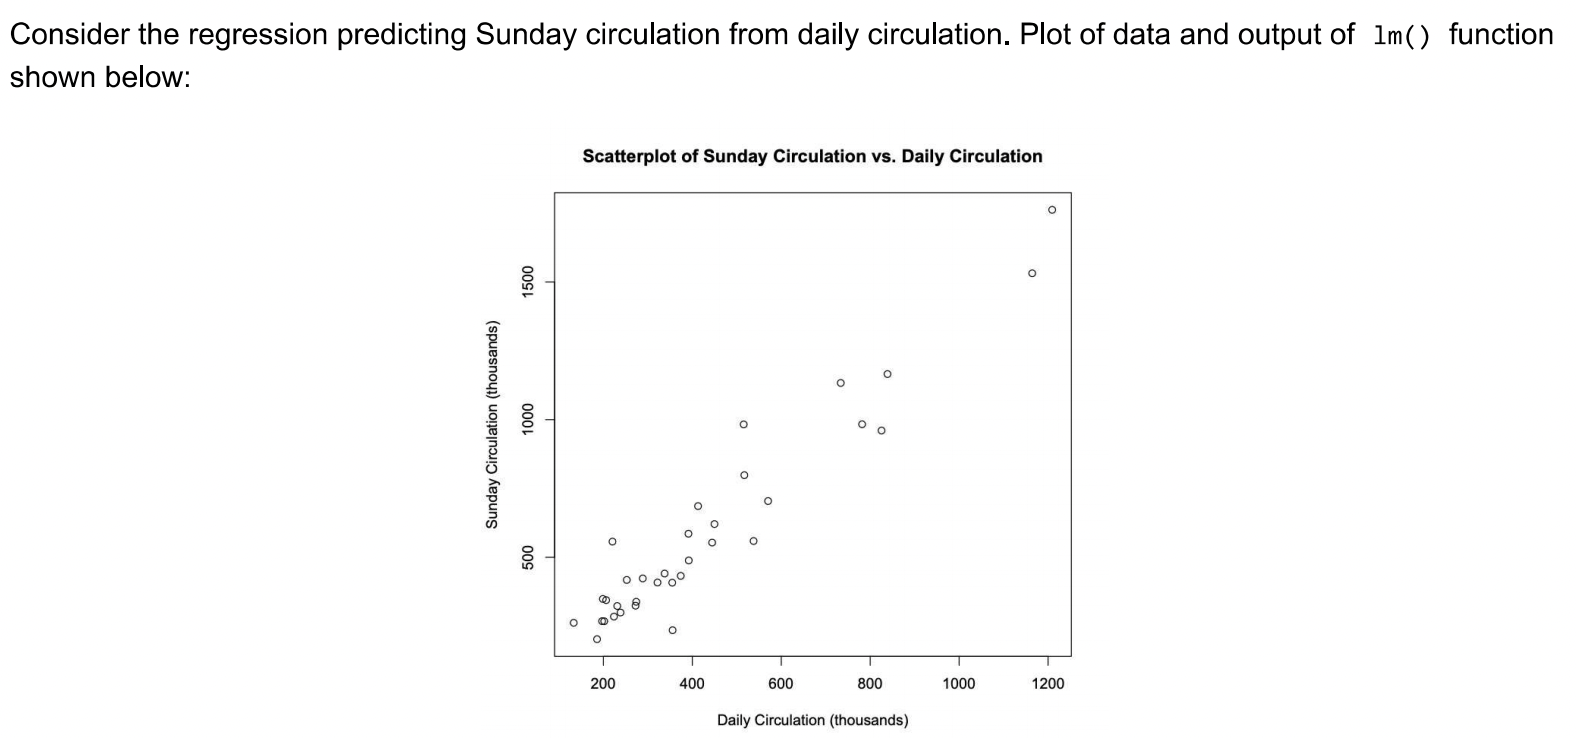
Consider the regression predicting Sunday circulation from daily circulation. Plot of data and output of 1m() function shown below: Scaltarplot of Sunday Circulation vs. Daily Circulation 0 g _ o E To' E W E E 0 O E 8 i=3. 9 ' o a a E .2 2' o W In 0 O U G O \"8; 7 D 0011000 a\" e 8: o D o O l i i l i l 200 400 600 800 1000 1200 Daily Circulation (thousands) Consider the regression predicting Sunday circulation from daily circulation. Plot of data and output of Im() function shown below:
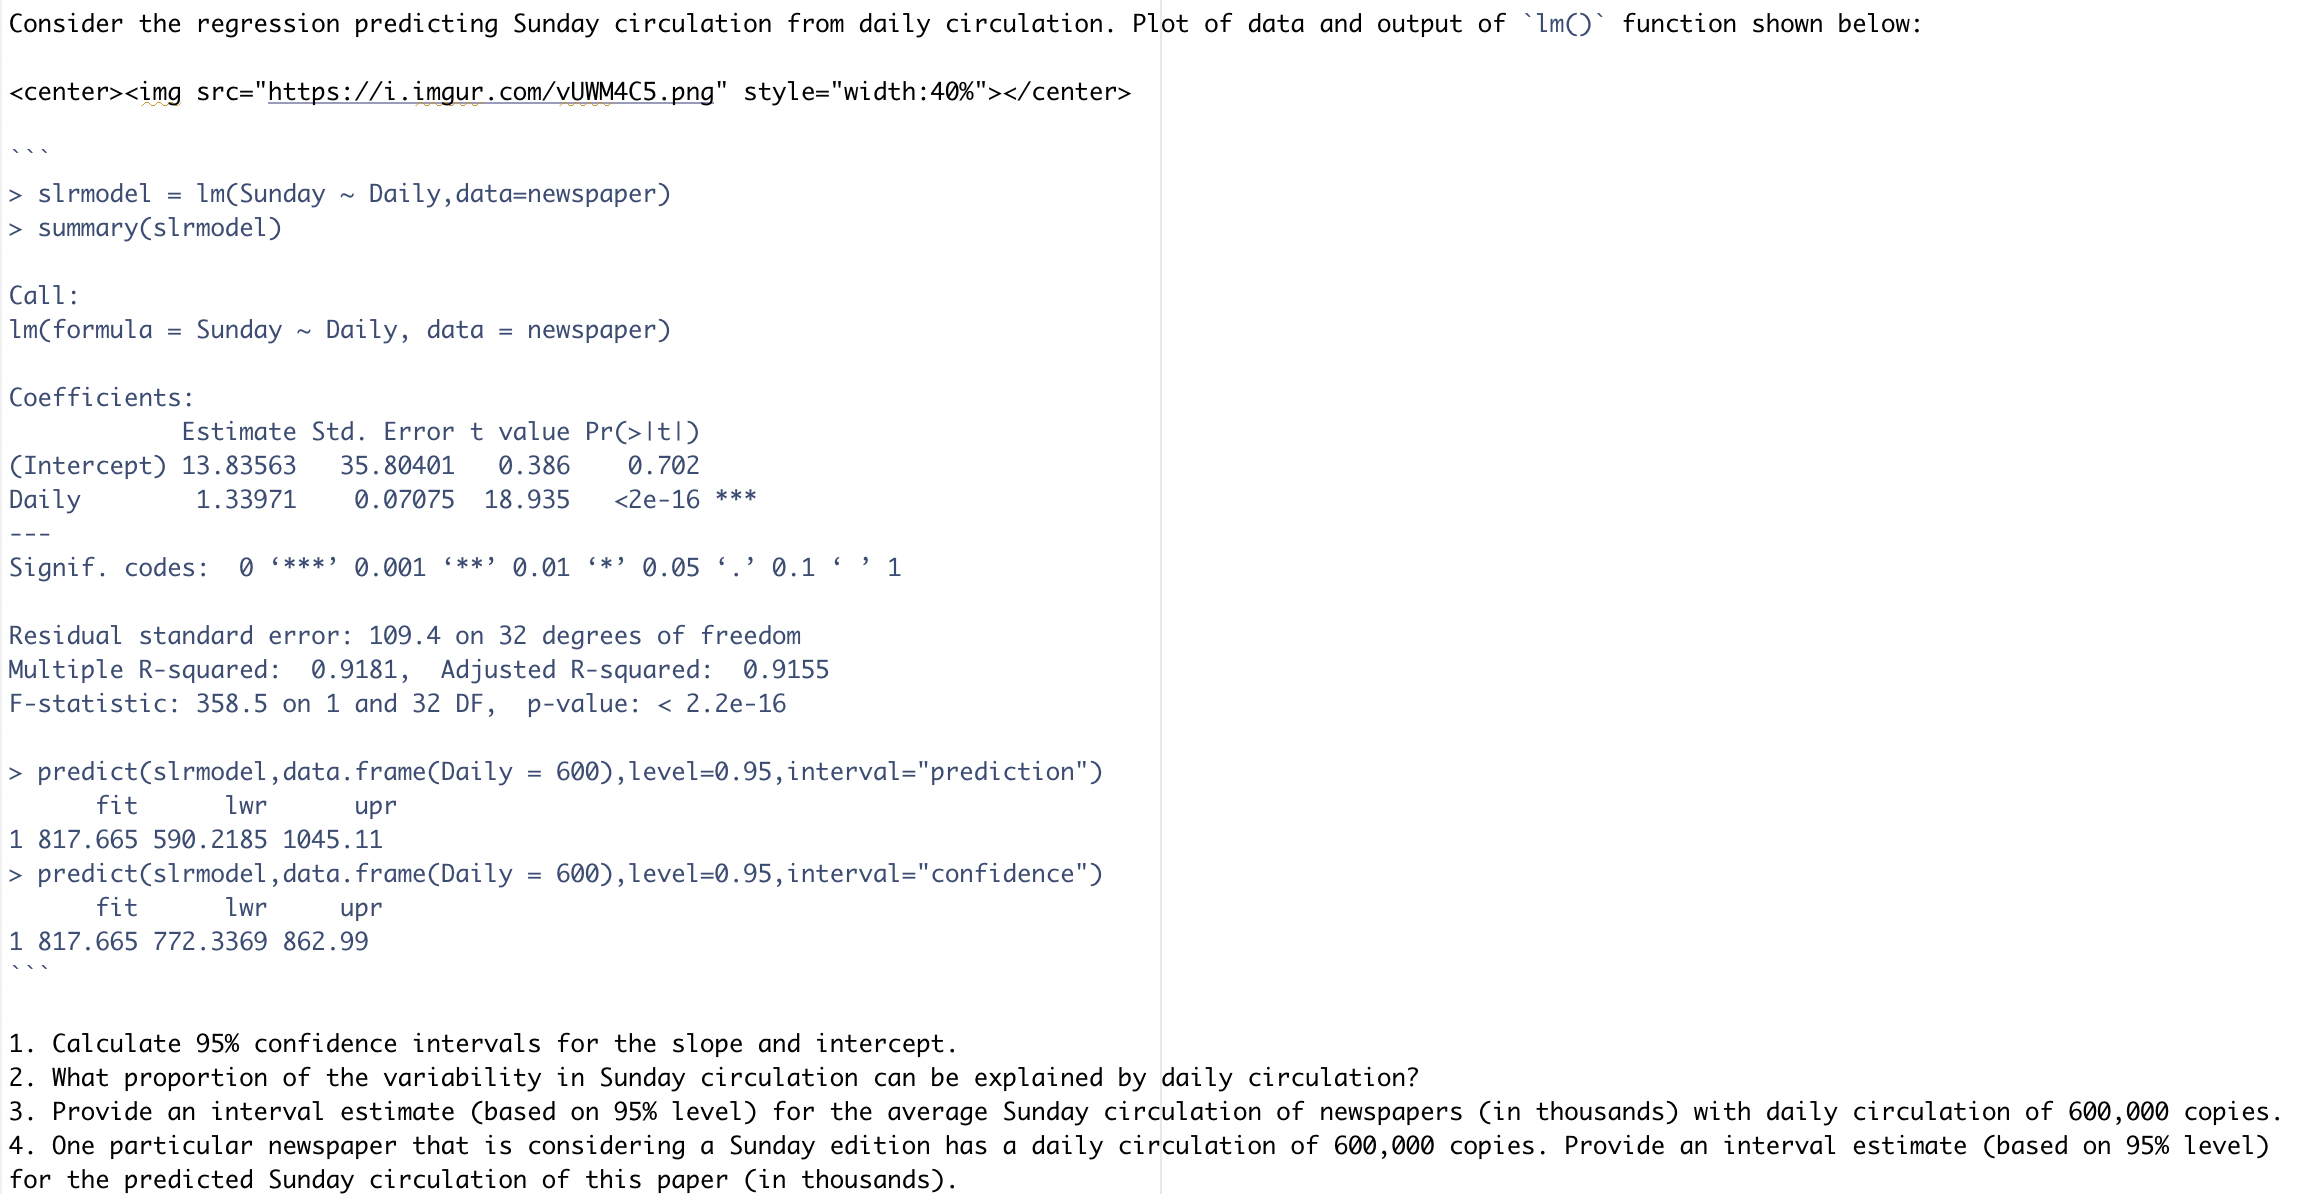
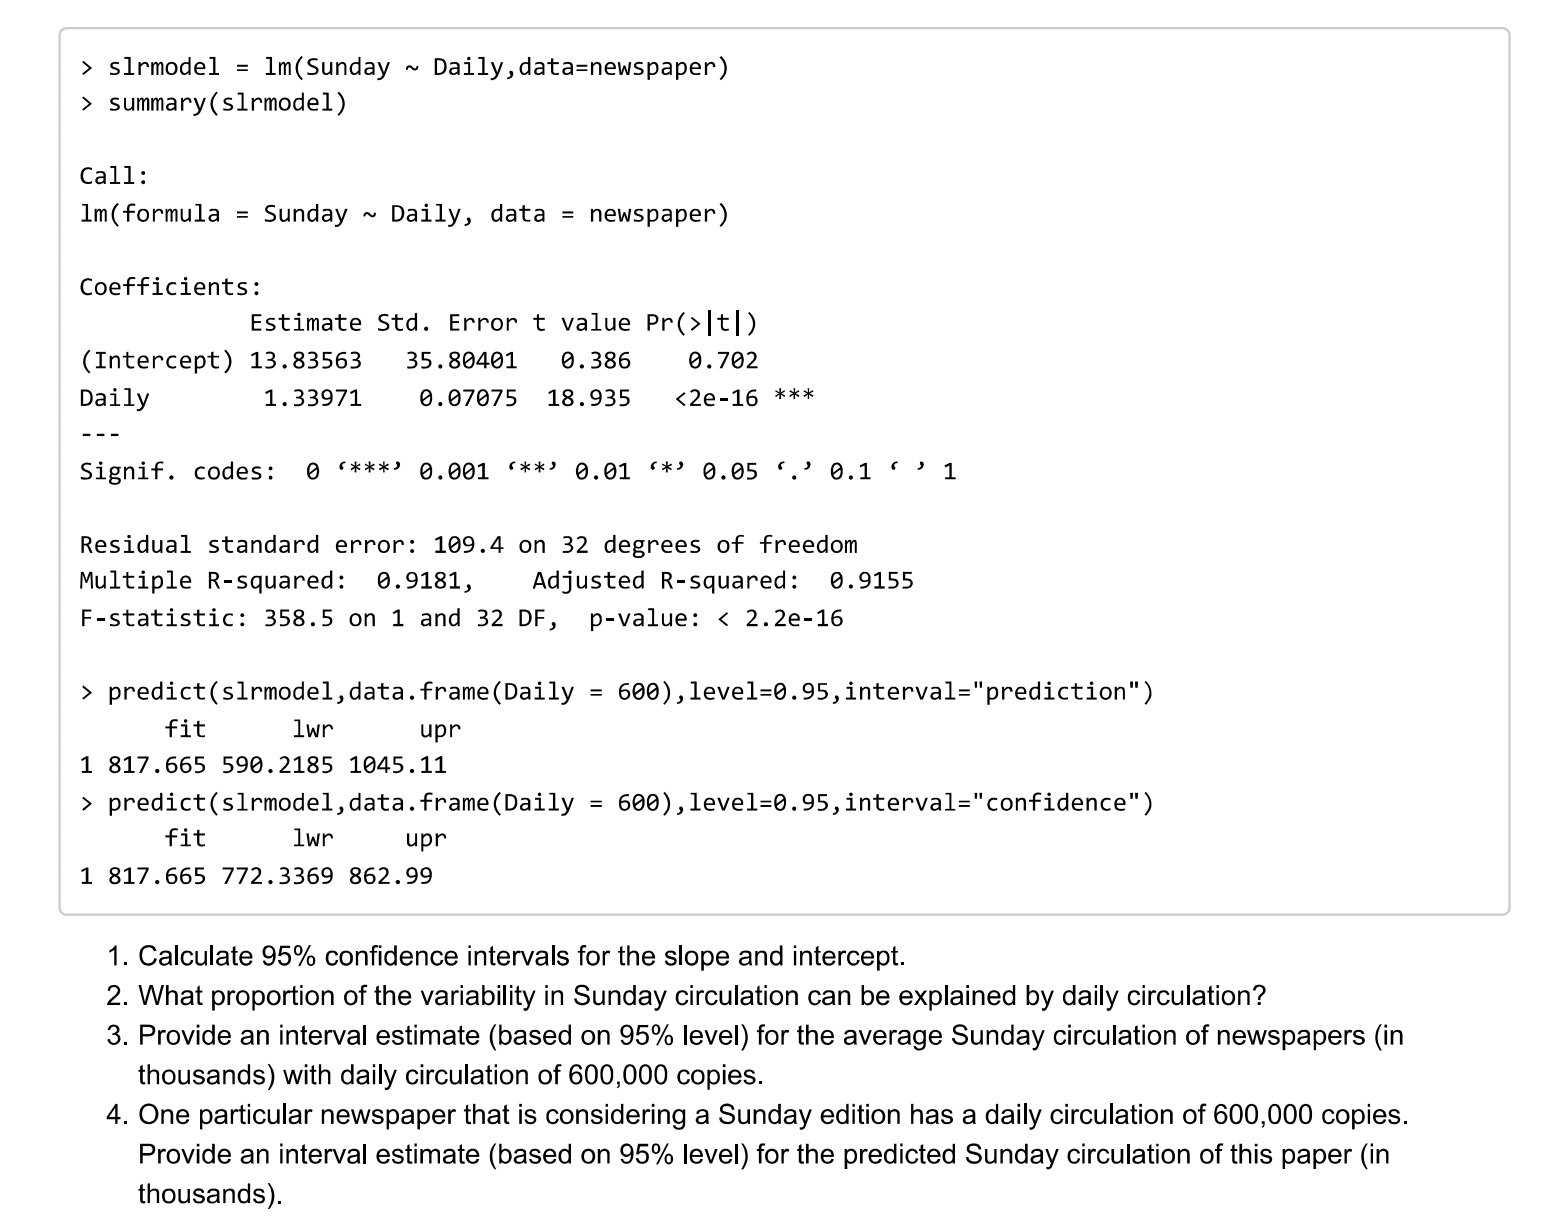
> sirmodel = lm(Sunday ~ Daily, data=newspaper) > summary (sirmodel) Call : Im(formula = Sunday ~ Daily, data = newspaper) Coefficients: Estimate Std. Error t value Pr(>Itl) (Intercept) 13. 83563 35. 80401 0. 386 0. 702 Daily 1. 33971 0. 07075 18.935 predict(sirmodel , data. frame(Daily = 600), level=0.95, interval="prediction") fit Lwr upr 1 817. 665 590. 2185 1045.11 > predict(sirmodel , data. frame(Daily = 600), level=0.95, interval="confidence") fit Lwr upr 1 817. 665 772. 3369 862.99 1. Calculate 95% confidence intervals for the slope and intercept. 2. What proportion of the variability in Sunday circulation can be explained by daily circulation? 3. Provide an interval estimate (based on 95% level) for the average Sunday circulation of newspapers (in thousands) with daily circulation of 600,000 copies. 4. One particular newspaper that is considering a Sunday edition has a daily circulation of 600,000 copies. Provide an interval estimate (based on 95% level) for the predicted Sunday circulation of this paper (in thousands).> sirmodel = 1m(Sunday ~ Daily, data=newspaper) > summary (sirmodel) Call : Im(formula = Sunday ~ Daily, data = newspaper) Coefficients : Estimate Std. Error t value Pr(> |t|) (Intercept) 13.83563 35. 80401 0. 386 0. 702 Daily 1. 33971 0. 07075 18.935 predict (slrmodel, data. frame (Daily = 600), level=0.95, interval="prediction") fit 1wr upr 1 817. 665 590. 2185 1045. 11 > predict(slrmodel, data . frame (Daily = 600) , level=0.95, interval="confidence") fit 1wr upr 1 817. 665 772. 3369 862.99 1. Calculate 95% confidence intervals for the slope and intercept. 2. What proportion of the variability in Sunday circulation can be explained by daily circulation? 3. Provide an interval estimate (based on 95% level) for the average Sunday circulation of newspapers (in thousands) with daily circulation of 600,000 copies. 4. One particular newspaper that is considering a Sunday edition has a daily circulation of 600,000 copies. Provide an interval estimate (based on 95% level) for the predicted Sunday circulation of this paper (in thousands)
Step by Step Solution
There are 3 Steps involved in it
1 Expert Approved Answer
Step: 1 Unlock
Question Has Been Solved by an Expert!
Get step-by-step solutions from verified subject matter experts
Step: 2 Unlock
Step: 3 Unlock
Students Have Also Explored These Related Mathematics Questions!