

Question: Use rate-of-return data over 60 -month period for Alphabet, the T-bill rate, and the S&P 500 , which will be used as the market-index portfolio
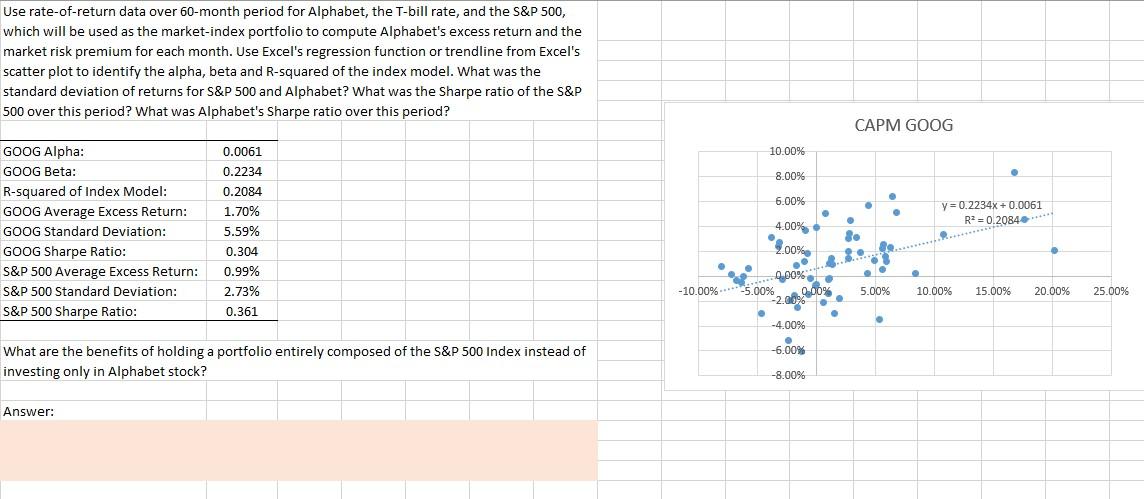
Use rate-of-return data over 60 -month period for Alphabet, the T-bill rate, and the S\&P 500 , which will be used as the market-index portfolio to compute Alphabet's excess return and the market risk premium for each month. Use Excel's regression function or trendline from Excel's scatter plot to identify the alpha, beta and R-squared of the index model. What was the standard deviation of returns for S\&P 500 and Alphabet? What was the Sharpe ratio of the S\&P 500 over this period? What was Alphabet's Sharpe ratio over this period
Step by Step Solution
There are 3 Steps involved in it
1 Expert Approved Answer
Step: 1 Unlock

Question Has Been Solved by an Expert!
Get step-by-step solutions from verified subject matter experts
Step: 2 Unlock
Step: 3 Unlock