

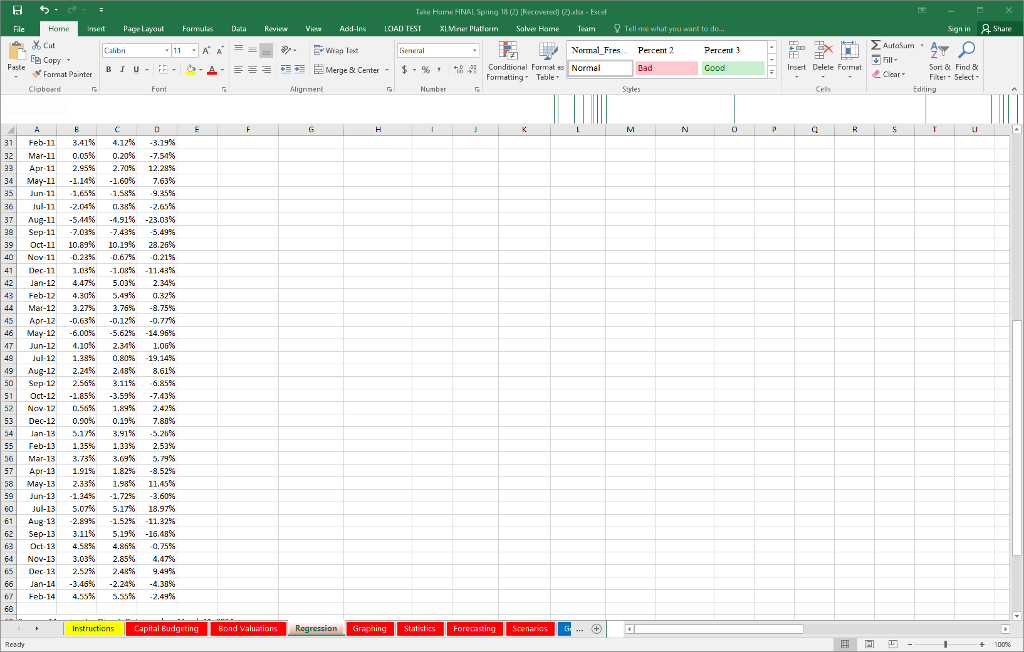
Question: Use regression function to find less risky stock and report the goodness of fot for each function, please show all steps and formulas Take Home
Use regression function to find less risky stock and report the goodness of fot for each function,
please show all steps and formulas
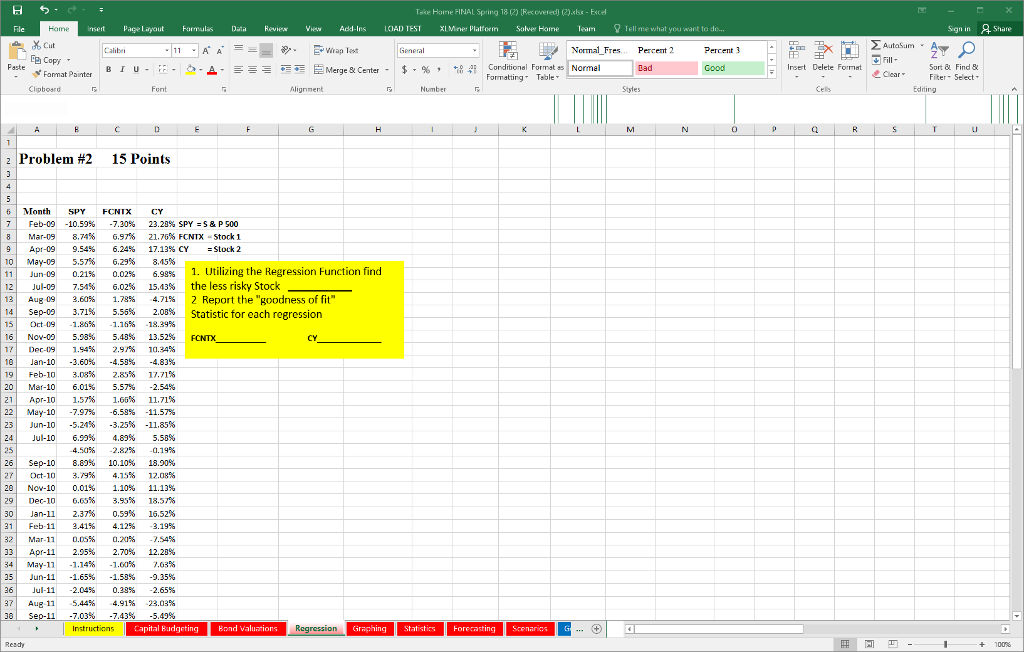
Take Home FINAL Spring 18 (Z) [Recovered) (2)3b -Este insert Page Layout Formulas Data Revi w Add-Ins LOAD TEST XLMer PlatformSolver Home Team Tell me what you want to do.. X Cut E Copy Fomat PainterBIU-- Normal Fres. Percent2 Percent 3 B I U . E-a. : $ , % ,??Conditional Format ssl Normal Sort &Find & Fiter Select ?? ? Merge & Center Irset Delete Format FormattingTable Cipboard Problem #2 15 Points 6 Month SPY 71 81 91 101 FCNIX CY 23.28% SPY-S&PS00 21.76% FCNTX-Stock 1 17.13% CY =stock 2 Feb-09-10.59% Mar-09 8.74% Apr-09 9.54% May-09 5.57% 0.21% Jul-09 7.54% Aug 09 3.60% Sep-09 3.71% Oct-09-1.86% Nov-09 5.93% Dec-09 1.94% ?an-10-3.60% Feb-10 3.08% Mar-10 6.01% Apr-10 1.57% May-10-7.97% Jun-10-5.24% Jul-10 6.99% -4.50% Sep-10 8.89% Oct-10 3.79% Nov-10 0.01% Dec-10 6.65% Jan-11 2.37% Feb-11 3.41% Mar-11 0.05% Apr-11 2.95% May-11-1.14% Jun-11-1.65% Jul-11-2.04% Aug 11-5.44% 7.03% -7.30% 6.97% 6.24% 6.29% 0.02% 6.02% 1.78% 5.55% -1.16% 5.43% 2.9/% -4.53% 2.85% 5.57% 1.65% -6.58% -3.25% 4.89% -2.82% 10.10% 4.15% 1.10% 3.95% 0.53% 4.12% 0.20% 2.70% -1.60% -1.53% 0.38% 4.91% -7.43% 8.45% 6.98% 15.43% 4.71% 2.03% -18.39% 13.52% 10.34% -4.83% 17.71% -2.54% 11.71% -11.57% -11.85% 5.58% -0.19% 18.90% 12.08% 11.13% 18.57% 16.52% -3.19% -7.54% 12.28% 7.63% -9.35% -2.65% -23.03% -5.49% 1. utilizing the Regression Function find the less risky Stock 2 Report the "goodness of fit" Statistic for each regression Jun-09 121 131 14 151 161 171 181 19 | 201 211 22 23 | 24 | FOND CY 26 271 28 | 291 30 | 311 321 331 341 35 | 261 371 36 Se Capital BudgetingBond valuations Take Home FINAL Spring 18 (Z) [Recovered) (2)3b -Este insert Page Layout Formulas Data Revi w Add-Ins LOAD TEST XLMer PlatformSolver Home Team Tell me what you want to do.. X Cut E Copy Fomat PainterBIU-- Normal Fres. Percent2 Percent 3 B I U . E-a. : $ , % ,??Conditional Format ssl Normal Sort &Find & Fiter Select ?? ? Merge & Center Irset Delete Format FormattingTable Cipboard Problem #2 15 Points 6 Month SPY 71 81 91 101 FCNIX CY 23.28% SPY-S&PS00 21.76% FCNTX-Stock 1 17.13% CY =stock 2 Feb-09-10.59% Mar-09 8.74% Apr-09 9.54% May-09 5.57% 0.21% Jul-09 7.54% Aug 09 3.60% Sep-09 3.71% Oct-09-1.86% Nov-09 5.93% Dec-09 1.94% ?an-10-3.60% Feb-10 3.08% Mar-10 6.01% Apr-10 1.57% May-10-7.97% Jun-10-5.24% Jul-10 6.99% -4.50% Sep-10 8.89% Oct-10 3.79% Nov-10 0.01% Dec-10 6.65% Jan-11 2.37% Feb-11 3.41% Mar-11 0.05% Apr-11 2.95% May-11-1.14% Jun-11-1.65% Jul-11-2.04% Aug 11-5.44% 7.03% -7.30% 6.97% 6.24% 6.29% 0.02% 6.02% 1.78% 5.55% -1.16% 5.43% 2.9/% -4.53% 2.85% 5.57% 1.65% -6.58% -3.25% 4.89% -2.82% 10.10% 4.15% 1.10% 3.95% 0.53% 4.12% 0.20% 2.70% -1.60% -1.53% 0.38% 4.91% -7.43% 8.45% 6.98% 15.43% 4.71% 2.03% -18.39% 13.52% 10.34% -4.83% 17.71% -2.54% 11.71% -11.57% -11.85% 5.58% -0.19% 18.90% 12.08% 11.13% 18.57% 16.52% -3.19% -7.54% 12.28% 7.63% -9.35% -2.65% -23.03% -5.49% 1. utilizing the Regression Function find the less risky Stock 2 Report the "goodness of fit" Statistic for each regression Jun-09 121 131 14 151 161 171 181 19 | 201 211 22 23 | 24 | FOND CY 26 271 28 | 291 30 | 311 321 331 341 35 | 261 371 36 Se Capital BudgetingBond valuations
Step by Step Solution
There are 3 Steps involved in it

Get step-by-step solutions from verified subject matter experts