

Question: use r-studio please River Abundance Tree.Area 7 0.34 17.2 4 0.6 20.7 3 0.9 24.1 14 1 29.8 5 1.1 25.3 1 1.2 34.4 13
use r-studio please
| River | Abundance | Tree.Area |
| 7 | 0.34 | 17.2 |
| 4 | 0.6 | 20.7 |
| 3 | 0.9 | 24.1 |
| 14 | 1 | 29.8 |
| 5 | 1.1 | 25.3 |
| 1 | 1.2 | 34.4 |
| 13 | 1.4 | 23 |
| 12 | 1.5 | 40.2 |
| 9 | 1.8 | 37.9 |
| 10 | 2 | 26.4 |
| 6 | 2.1 | 40.2 |
| 11 | 2.3 | 34.4 |
| 8 | 2.6 | 41.3 |
| 15 | 2.9 | 43.6 |
| 2 | 3.4 | 47.1 |
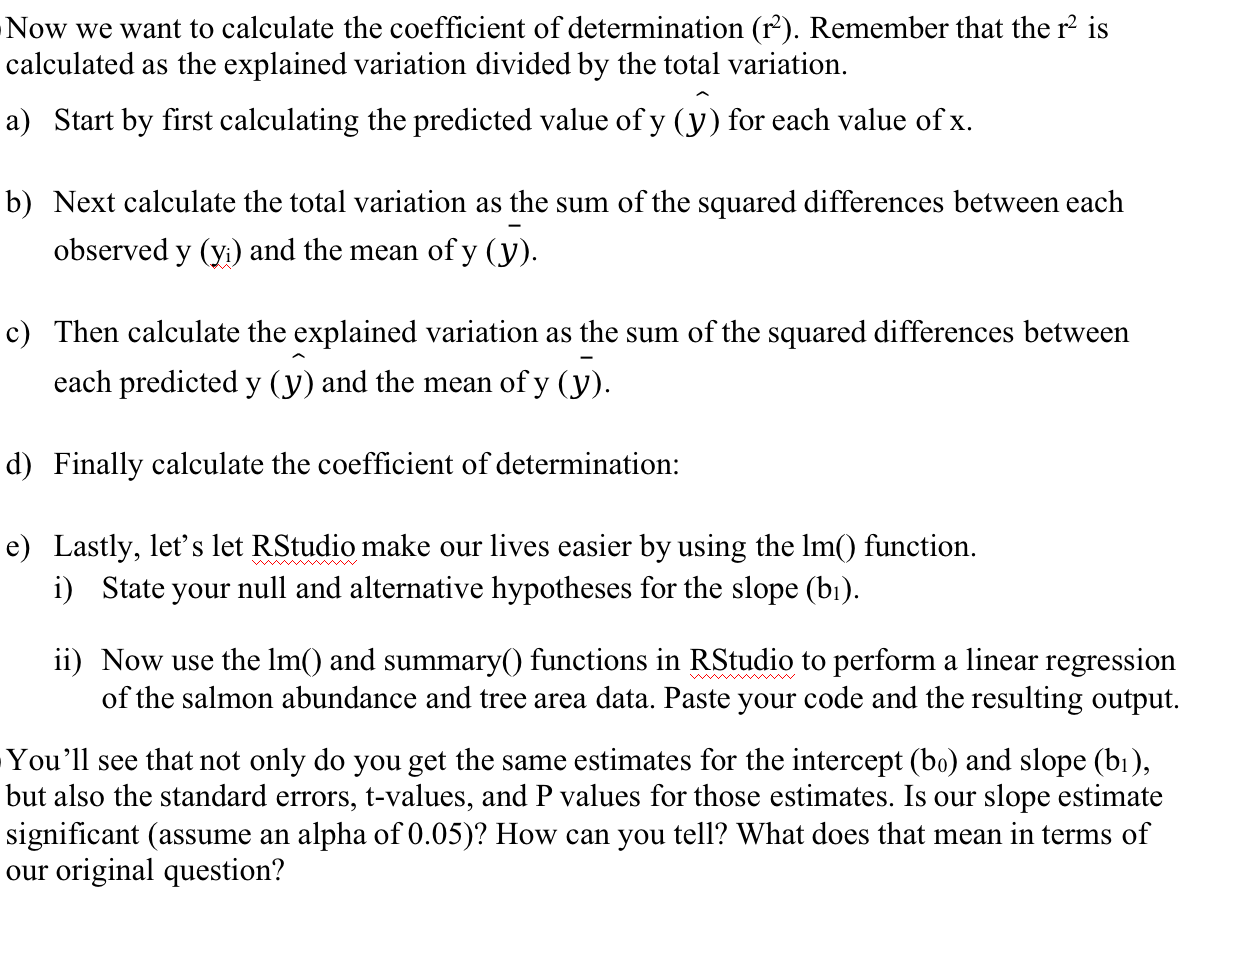
You take a summer internship in southeast Alaska evaluating the relationship between salmon abundance and riparian vegetation density among 15 streams. You hypothesize that the nutrients salmon bring back to streams in their bodies makes for larger and more abundant trees. You measure the basal area of trees in square meters per acre, within 100m of fish bearing streams. You then use the Alaska Department of Fish and Game's salmon run data to find the average number of fish (in 1000's) for each river. I Now we want to calculate the coefcient of determination (r2). Remember that the r2 is calculated as the explained variation divided by the total variation. a) Start by first calculating the predicted value of y (y) for each value of x. b) Next calculate the total variation as the sum of the squared differences between each observed y (ya) and the mean of y (y). c) Then calculate the explained variation as the sum of the squared differences between each predicted y (y) and the mean of y (3;). d) Finally calculate the coefficient of determination: e) Lastly, let's let RStudio make our lives easier by using the lm() function. i) State your null and alternative hypotheses for the slope (b1). ii) Now use the lm() and summary() functions in RStudio to perform a linear regression of the salmon abundance and tree area data. Paste your code and the resulting output. You'll see that not only do you get the same estimates for the intercept (b0) and slope (b1), but also the standard errors, t-values, and P values for those estimates. Is our slope estimate signicant (assume an alpha of 0.05)? How can you tell? What does that mean in terms of our original
Step by Step Solution
There are 3 Steps involved in it

Get step-by-step solutions from verified subject matter experts