

Question: USE SAMPLE SIZE 7 PLEASE! Control charts for X and s are to be established on the Brinell hardness of hardened tool steel in kilograms
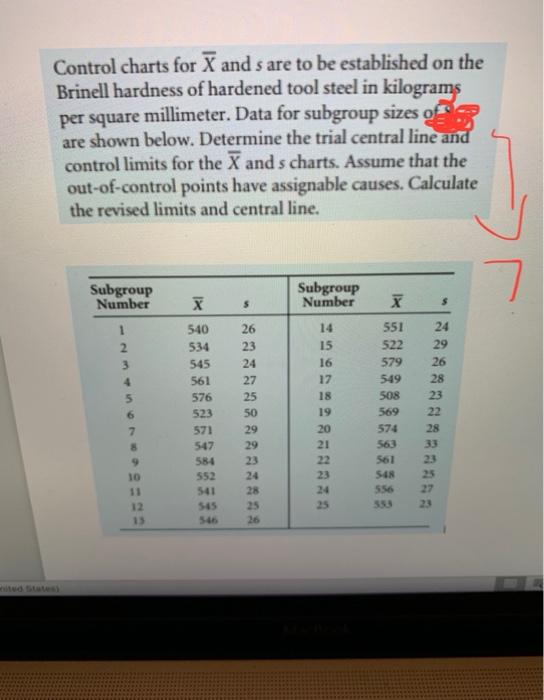
Control charts for X and s are to be established on the Brinell hardness of hardened tool steel in kilograms per square millimeter. Data for subgroup sizes of 3 are shown below. Determine the trial central line and control limits for the X and s charts. Assume that the out-of-control points have assignable causes. Calculate the revised limits and central line. Subgroup Number Subgroup Number X 5 X 1 2 3 24 29 26 28 540 534 545 561 576 523 571 547 584 552 541 545 26 23 24 27 25 50 29 29 14 15 16 17 18 19 20 21 551 522 579 549 508 569 574 5 6 7 8 9 10 23 22 28 33 23 23 24 561 5.4 556 27 24 28 25 26 12 15 Control charts for X and s are to be established on the Brinell hardness of hardened tool steel in kilograms per square millimeter. Data for subgroup sizes of 3 are shown below. Determine the trial central line and control limits for the X and s charts. Assume that the out-of-control points have assignable causes. Calculate the revised limits and central line. Subgroup Number Subgroup Number X 5 X 1 2 3 24 29 26 28 540 534 545 561 576 523 571 547 584 552 541 545 26 23 24 27 25 50 29 29 14 15 16 17 18 19 20 21 551 522 579 549 508 569 574 5 6 7 8 9 10 23 22 28 33 23 23 24 561 5.4 556 27 24 28 25 26 12 15
Step by Step Solution
There are 3 Steps involved in it

Get step-by-step solutions from verified subject matter experts