

Question: please need help on problems 2 and 3. use the chart for problem 2 and 3 6. Control charts for X and s are to
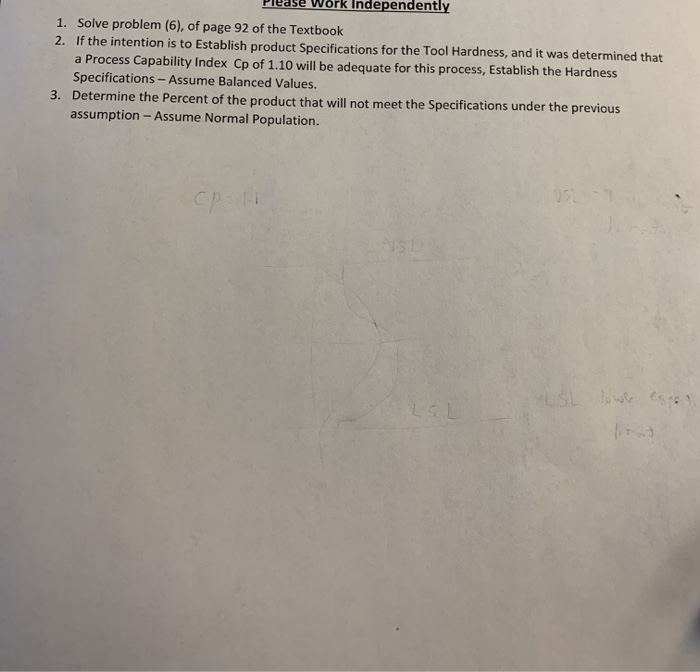
please need help on problems 2 and 3. use the chart for problem 2 and 3 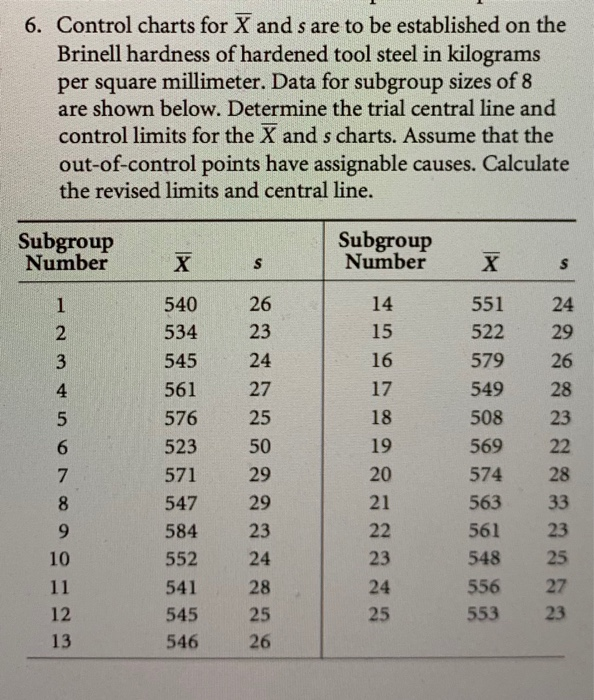
Step by Step Solution
There are 3 Steps involved in it
1 Expert Approved Answer
Step: 1 Unlock

Question Has Been Solved by an Expert!
Get step-by-step solutions from verified subject matter experts
Step: 2 Unlock
Step: 3 Unlock