

Question: use (sink&source digram) process integration 3.3 A thermomechanical pulp and newsprint mill consisting of 54 sinks and 10 sources (Jacob et al., 2002). The source
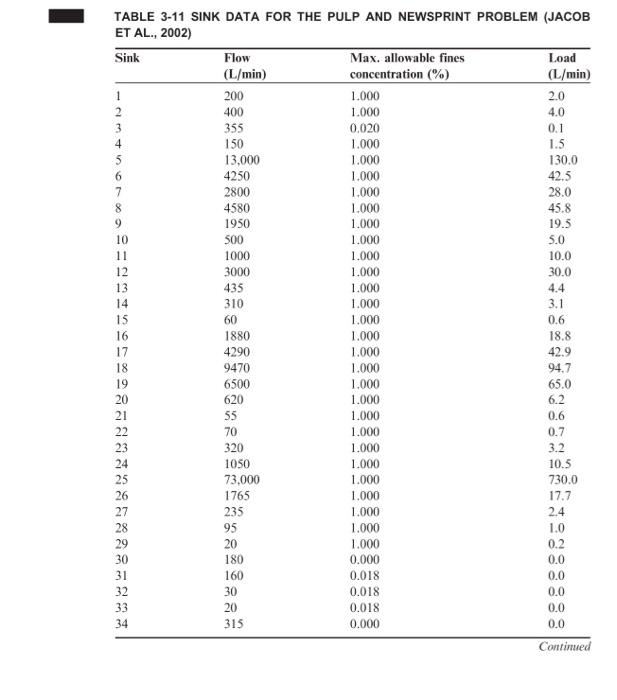
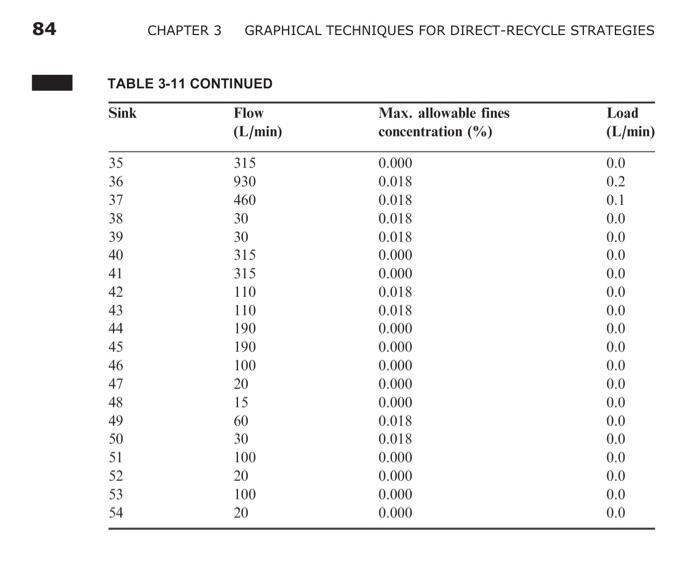
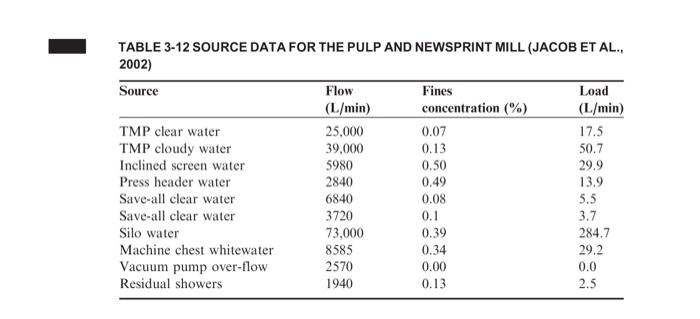
3.3 A thermomechanical pulp and newsprint mill consisting of 54 sinks and 10 sources (Jacob et al., 2002). The source and sink data can be seen in Tables 3-11 and 3-12. Identify a target for minimum water usage and minimum waste discharge. 0.1 150 1950 TABLE 3-11 SINK DATA FOR THE PULP AND NEWSPRINT PROBLEM (JACOB ET AL., 2002) Sink Flow Max. allowable fines Load (L/min) concentration (%) (L/min) 1 200 1.000 2.0 2 400 1.000 4.0 3 355 0.020 4 1.000 1.5 5 13.000 1.000 130.0 4250 1.000 42.5 7 2800 1.000 28.0 8 4580 1.000 45.8 9 1.000 19.5 10 500 1.000 5.0 11 1000 1.000 10,0 12 3000 1.000 30.0 13 435 1.000 4.4 14 310 1.000 3.1 15 60 1.000 0.6 16 1880 1.000 18.8 17 4290 1.000 42.9 18 9470 1.000 94.7 19 6500 1.000 65.0 20 620 1.000 6.2 21 55 1.000 0.6 22 70 1.000 0.7 23 1.000 3.2 24 1050 1.000 10.5 25 73.000 1.000 730.0 26 1.000 17.7 27 2.4 28 95 1.000 29 1.000 30 180 0.000 0.0 31 160 0.018 0.0 32 30 0.018 0.0 33 20 0.018 0.0 34 0.000 0.0 Continued 320 1765 235 1.000 20 1.0 0.2 315 84 CHAPTER 3 GRAPHICAL TECHNIQUES FOR DIRECT-RECYCLE STRATEGIES TABLE 3-11 CONTINUED Sink Flow (L/min) Max. allowable fines concentration (%) Load (L/min) 315 930 460 30 30 315 35 36 37 38 39 40 41 42 43 44 45 46 47 48 49 50 51 52 53 54 315 110 110 190 190 100 20 15 60 30 100 20 100 20 0.000 0.018 0.018 0.018 0.018 0.000 0.000 0.018 0.018 0.000 0.000 0.000 0.000 0.000 0.018 0.018 0.000 0.000 0.000 0.000 0.0 0.2 0.1 0.0 0.0 0.0 0.0 0.0 0.0 0.0 0.0 0.0 0.0 0.0 0.0 0.0 0.0 0.0 0.0 0.0 TABLE 3-12 SOURCE DATA FOR THE PULP AND NEWSPRINT MILL (JACOB ET AL., 2002) Source Flow Fines Load (L/min) concentration (%) (L/min) TMP clear water 25,000 0.07 17.5 TMP cloudy water 39.000 0.13 50.7 Inclined screen water 5980 0.50 29.9 Press header water 2840 0.49 13.9 Save-all clear water 6840 0.08 5.5 Save-all clear water 3720 0.1 Silo water 73,000 284.7 Machine chest whitewater 8585 0.34 29.2 Vacuum pump over-flow 2570 0.00 0.0 Residual showers 1940 0.13 2.5 3.7 0.39 3.3 A thermomechanical pulp and newsprint mill consisting of 54 sinks and 10 sources (Jacob et al., 2002). The source and sink data can be seen in Tables 3-11 and 3-12. Identify a target for minimum water usage and minimum waste discharge. 0.1 150 1950 TABLE 3-11 SINK DATA FOR THE PULP AND NEWSPRINT PROBLEM (JACOB ET AL., 2002) Sink Flow Max. allowable fines Load (L/min) concentration (%) (L/min) 1 200 1.000 2.0 2 400 1.000 4.0 3 355 0.020 4 1.000 1.5 5 13.000 1.000 130.0 4250 1.000 42.5 7 2800 1.000 28.0 8 4580 1.000 45.8 9 1.000 19.5 10 500 1.000 5.0 11 1000 1.000 10,0 12 3000 1.000 30.0 13 435 1.000 4.4 14 310 1.000 3.1 15 60 1.000 0.6 16 1880 1.000 18.8 17 4290 1.000 42.9 18 9470 1.000 94.7 19 6500 1.000 65.0 20 620 1.000 6.2 21 55 1.000 0.6 22 70 1.000 0.7 23 1.000 3.2 24 1050 1.000 10.5 25 73.000 1.000 730.0 26 1.000 17.7 27 2.4 28 95 1.000 29 1.000 30 180 0.000 0.0 31 160 0.018 0.0 32 30 0.018 0.0 33 20 0.018 0.0 34 0.000 0.0 Continued 320 1765 235 1.000 20 1.0 0.2 315 84 CHAPTER 3 GRAPHICAL TECHNIQUES FOR DIRECT-RECYCLE STRATEGIES TABLE 3-11 CONTINUED Sink Flow (L/min) Max. allowable fines concentration (%) Load (L/min) 315 930 460 30 30 315 35 36 37 38 39 40 41 42 43 44 45 46 47 48 49 50 51 52 53 54 315 110 110 190 190 100 20 15 60 30 100 20 100 20 0.000 0.018 0.018 0.018 0.018 0.000 0.000 0.018 0.018 0.000 0.000 0.000 0.000 0.000 0.018 0.018 0.000 0.000 0.000 0.000 0.0 0.2 0.1 0.0 0.0 0.0 0.0 0.0 0.0 0.0 0.0 0.0 0.0 0.0 0.0 0.0 0.0 0.0 0.0 0.0 TABLE 3-12 SOURCE DATA FOR THE PULP AND NEWSPRINT MILL (JACOB ET AL., 2002) Source Flow Fines Load (L/min) concentration (%) (L/min) TMP clear water 25,000 0.07 17.5 TMP cloudy water 39.000 0.13 50.7 Inclined screen water 5980 0.50 29.9 Press header water 2840 0.49 13.9 Save-all clear water 6840 0.08 5.5 Save-all clear water 3720 0.1 Silo water 73,000 284.7 Machine chest whitewater 8585 0.34 29.2 Vacuum pump over-flow 2570 0.00 0.0 Residual showers 1940 0.13 2.5 3.7 0.39
Step by Step Solution
There are 3 Steps involved in it

Get step-by-step solutions from verified subject matter experts